The graph below shows all full-time members’ average monthly use of health clubs in Miami and Florida in 2017. The pie charts show the age profile of male and female members of this health club. Summarise the information by selecting and reporting the main features, and make comparisons where relevant.
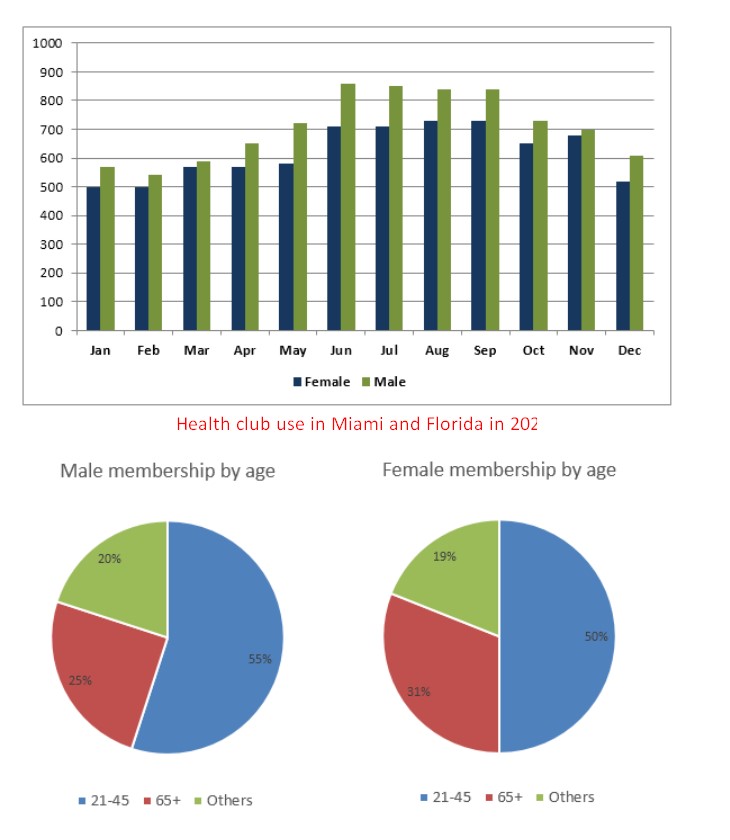
The bar graph depicts the average utilisation of full time male and female members of the health club’s of Miami and Florida by each month in the year 2017. The pie chart displayed the proportion of these members in terms of age and gender.
Overall, The highest average use of health clubs over the months was men compared to women, and just over half of them accounted for the adolescent age group, and the same trend can be seen in women’s age profile.
In the first month of January, 500 women were active members in various clubs in Miami and Florida, whereas the male counterparts were slightly higher than this figure. The average use of health clubs among males and females consistently remained constant up to April, then slightly began to escalated and reached about a peak with more than 800 males and 700 females in June and July respectively before these numbers plummeted into the final month. In December, women devoted only more than 500 whereas men were accounted for more than 600, which was remarkably remained higher in the average utilisation of health centres.
More than half of the male members Of the fitness clubs were between 21 to 45 years old, while this was exactly half proportion for women. The second leading age group was the senior citizens, age above 60, in that both male and female occupied one quarter and more than third respectively. Other age groups of both men and women used the facility at a similar proportion of a fifth or participants.
Follow Us on IELTSFever Instagram for more updates and the latest test tasks.
Also Read The Charts Below Show The Results of A Survey of Adult Education
Discover more from IELTS Fever
Subscribe to get the latest posts sent to your email.