The graph below shows waste recycling rates in the U.S. from 1960 to 2011. Summarise the information by selecting and reporting the main features, and make comparisons where relevant.
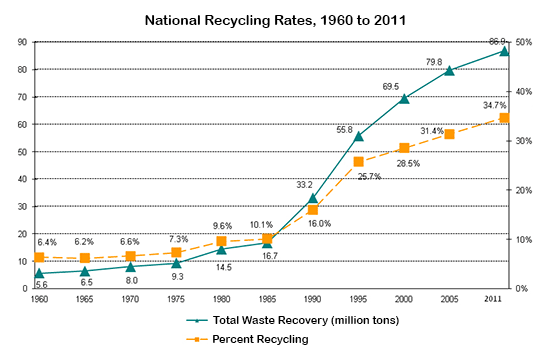
The line chart compares the percentage of recycling waste in the country of the US over a period of half a century from 1960 to 2011.
Overall, it is immediately apparent from the chart that the national recycling rates absorbed massive inclination between two methods of waste and recycling. However, the ratio of per cent of recycling had the lowest number while it doubled in-total waste recovery, with the rates finally reaching 86.9%.
In detail, the percentage of the total waste recovery in the US began at 5.6 M tons, and only 6.4% of waste got recycled in 1960. Similarly, the rate of total waste surged after every five years will share 6.5 M tons in 1965, but only 6.2% of waste got recycled from the recovery of 6.5 M tons. At the same time, 9.3 M tons of waste were recovered in the US, and 7.3% of waste was reprocessed in 1975. Moreover, there were 16.7 M Tons of waste found in the region of the US, and 10.1% of waste got resue from the total 16.7M T in 1980.
Furthermore, there was a huge difference in a total waste recovery at 55.8 M tons, which offered 5.7% of waste got reused in the year 1995 and five years later the tendency of waste hiked by 14 M tons with the recovery of waste at 28.5%. Whilst, 31.4% of waste was recycled from 79.8 MT of recovery in 2005. Whereas the total recovery of waste surprised in the US and hit the peak with shares at 86.9 M tons, unfortunately, the recycling per cent plummeted and reached 34.7% in the year 2011.
Follow Us on IELTSFever Twitter for more updates

