
The graph shows the estimated oil production capacity for several Gulf countries between 1990 and 2010. Summarise the information by selecting and reporting the main features, and make comparisons where relevant.
 Sample Answer of The Graph Shows the Estimated Oil Production Capacity for Several Gulf Countries Between 1990 and 2010.
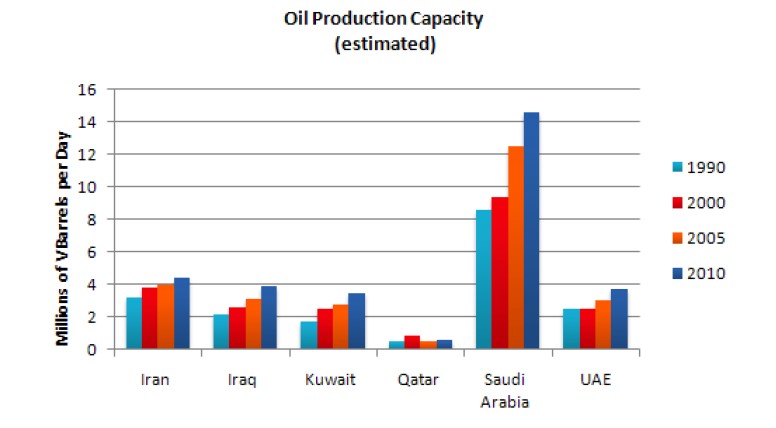
The provided bar chart enumerates the projected oil production capacity for six different nations over a two decades period of time. Besides, the units are calibrated in Millions of V barrels per day.
Overall, it is lucid that the majority of oil consumption was in Saudi Arabia, whilst the least production was from Qatar. However, the remaining nations, namely, Iran, Iraq, Kuwait, and UAE, have an akin range of oil productions over a period of time from 1990 to 2010.
Although the highest oil production capacity was from Saudi Arabia with 8 million barrels and reached the culmination of approximately 14 million barrels per day meanwhile, Iran’s oil production capacity was roughly three during the year 1990 and rose slightly to approximately 4 million barrels in the year 2010 even though the lowest oil production capacity was from Qatar with beneath 2 million barrels per day over two decades without any climb.
However, the remaining nations, Iraq, Kuwait, and UAE, have a similar production capacity for oil, commencing with 2 million barrels and rising dramatically to 4 million barrels for all three countries. As a matter of fact, these three nations were below 4 million during the period of time.
Follow Us on IELTSFever Twitter for more updates
Discover more from IELTS Fever
Subscribe to get the latest posts sent to your email.


