
The graph shows the percentage of male and female academic staff members across the faculties of a major university in 2016. Summarise the information by selecting and reporting the main feature, and make comparisons where relevant.
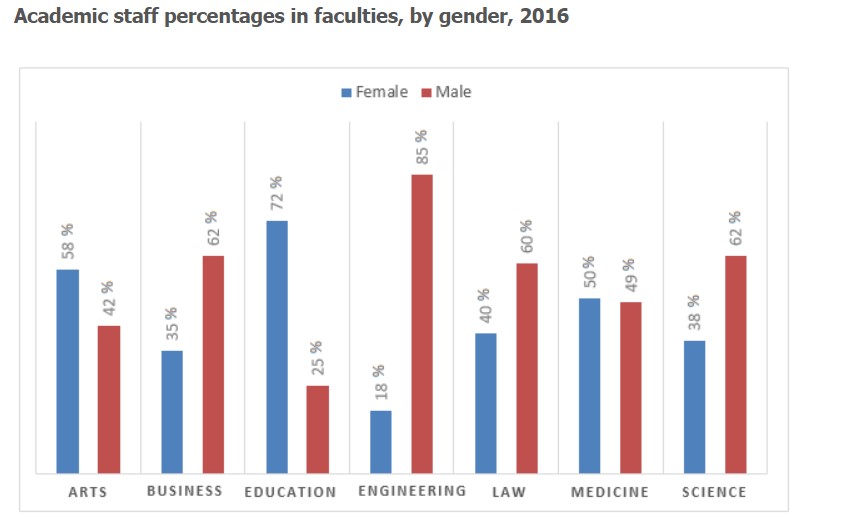
The graph illustrates the ratio of male to female teachers in a particular higher institution in various departments, namely Arts, businesses, education, engineering, law, medicine and science in 2016 expressed in percentage. Overall, it could be seen clearly that the males dominated most of the section, with the exception of the faculty of education and arts, where women took the lead.
On the one hand, the engineering department had the highest percentage of male tutors (85%), and both the science and business section had 62% each, followed by law. However, some departments like arts and education had the lowest population of male teachers, which were 42% and 25% respectively.
On the other hand, women had their peak population in the faculty of education with 72%, followed by arts with 58% and 50% in medicine. Other departments had a low number of females with 40% in law, 38% in science and 35% in business. The engineering unit had the lowest female percentage of 18 in all the faculties of the school.
Follow Us on IELTSFever Twitter for more updates
Discover more from IELTS Fever
Subscribe to get the latest posts sent to your email.


