
The graphs below show the global robotics market during 2000 and 2025 based on sectors. Summarize the information by selecting and reporting the main features, and make comparisons where relevant.
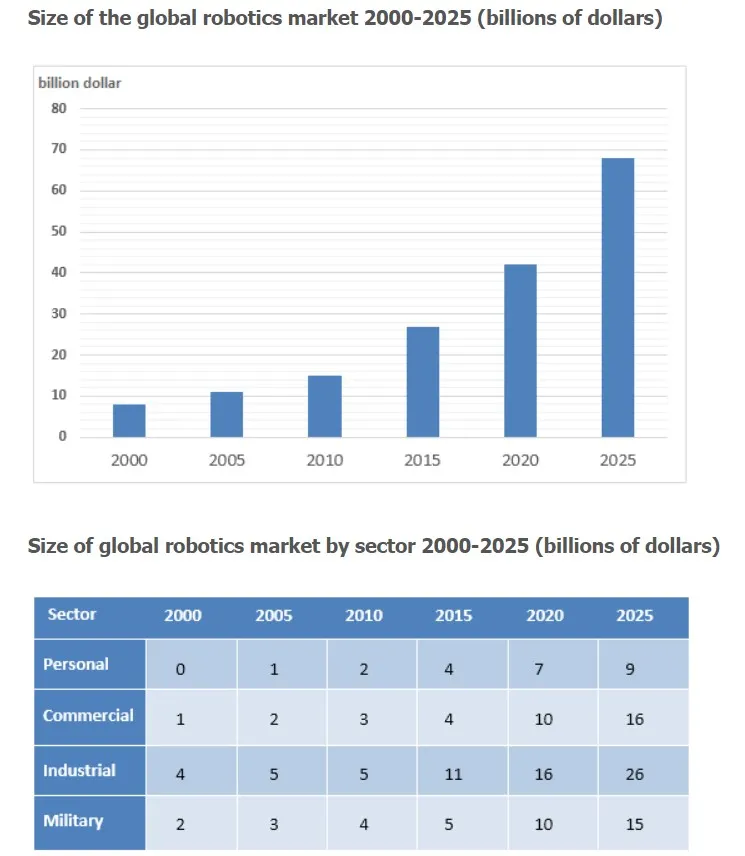
The given bar charts illustrate the global sales market in robotics and consider four sectors during 2000 and 2025.
Overall, it is seen from the first graph that sales are rising in 2025 as compared to 2000, however, in the industrial sector, the sales are increasing in 2025 as compared to the other sectors, which is also true in 2000.
In the personal sector, the size of the global robotic market rose from 1 billion dollars in 2005 and will rise in 2025 to 9 billion dollars. In addition, the global market has increased in 2020 by 10 billion dollars and shall rise by 2025 approximately 16 billion dollars.
Furthermore, in the industrial sector, the global size for the market in 2000 was 4 billion dollars and continues to increase in 2020 by 16 billion dollars and will continue to increase in 2025 as compared to others. In the military sector, the market was at 2 billion dollars in 2000, which surged to 10 billion dollars in 2010 and also will rise in 2025 by 15 billion dollars.
Follow Us on IELTSFever Twitter for more updates
Also read: The Graphs Show Changes in the Spending Habits of People in the UK
Discover more from IELTS Fever
Subscribe to get the latest posts sent to your email.


