
The graphs below show the numbers of male and female workers in 1975 and 1995 in several employment sectors of the republic of Freedonia. Write a report for a university teacher describing the information shown.
 Sample Answer of The Graphs Below Show the Numbers of Male and Female Workers in 1975 and 1995: Ac Writing
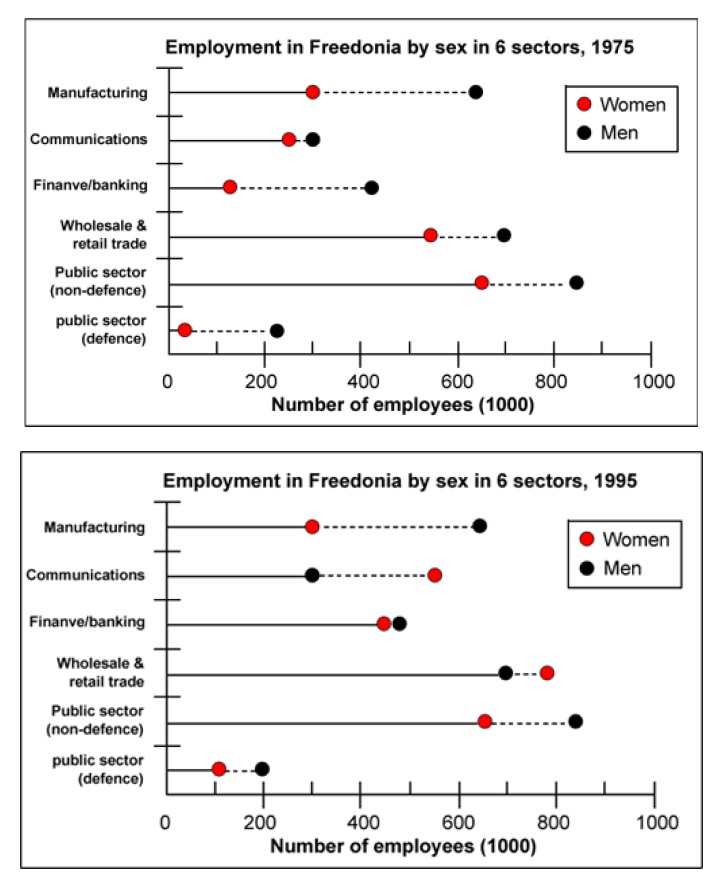
The time graph listed the information about enrollment in Freedonia by gender in the various field between 1975 and 1995.
According to the chart, in the years 1975 and 1995 the manufacturing sector was similar in both the sex around 300,000 women and 700000 men. Additionally, the communications sector increased the number of women workers in 1995 to 600000. While 1975 it has half of its employees working in Freedonia. Public sector defence rose rapidly in gender ranging between 30000 to 200 thousand in female or 200000 in males from 1975 to 1995.
Moving further, the banking sector had double the employee after 20 years, approximately 500000. Whereas, wholesales and retailer Trade sector working man less than 1995 about 700 thousand. Adding to this ladies dramatically growth in this field at 5 lakh to 8 lakh employees. It was interesting to see that the number of staff was equal in the public, not defence sector, without any change.
Overall, manufacturing and public sector in non-defence never change in 20 years while in other sector males was more working than females.
Follow Us on IELTSFever Twitter for more updates
Discover more from IELTS Fever
Subscribe to get the latest posts sent to your email.


