The Graphs Below Show the Types of Music Albums Purchased by People in Britain. Write a Report for A University Lecturer Describing the Information Shown Below.
 Sample Answer: The Graphs Below Show the Types of Music Albums Purchased by People in Britain
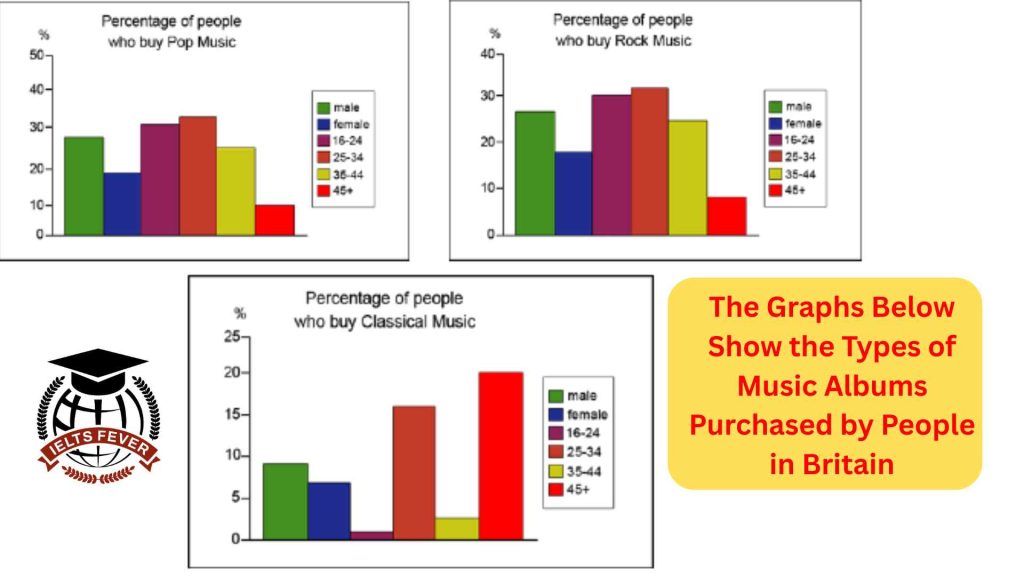
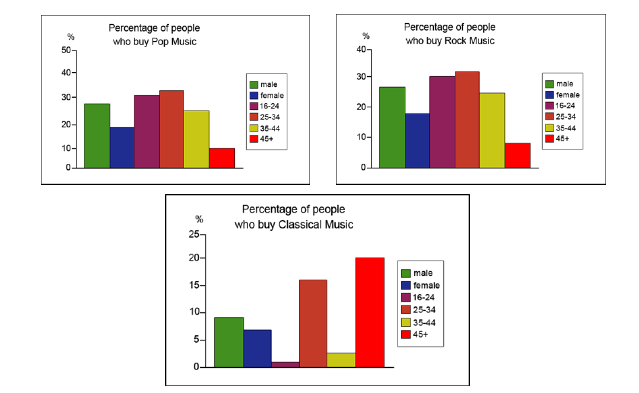
The bar graph illustrates the information about the types of music albums purchased by people in Britain.
Overall, the graphs indicate that the percentage of males is higher than that of females across all music genres.
To begin with, in pop music, the 16-24 and 25-34 age groups have almost equal percentages, which is nearly just under a third. Moreover, the 35 -44 and over 45 age groups have a significant difference in pop music, with almost one quarter and one in ten per cent, respectively. Males and females have nearly a 10 per cent difference in pop music. Males have 29 per cent, and females have 19 per cent.
Moving further, rock music looks similar to pop music as well, just with a bit of fluctuation. In classical music, the age group 25 -34 and 35 -44 shows the very least interest in classical music, which is almost negligible. Probing further, the 16 -24 and over 45 age groups accounted for 15 and 20 per cent respectively. The male and female percentage in classical music lies between 5 and 10 per cent.
Follow Us on IELTSFever instagram Page for more updates
Discover more from IELTS Fever
Subscribe to get the latest posts sent to your email.


