


The graphs show changes in the spending habits of people in the UK between 1971 and 2001. Write a report to a university lecturer describing data.

The provided two pie charts compared the english citizen six different spending habits in the UK from
1971 to 2001.
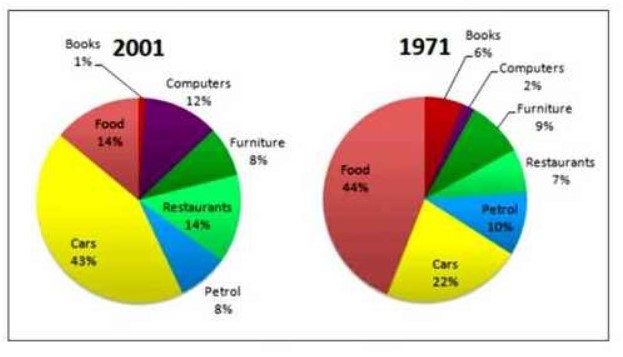
Overall, in the past times, main habits was foods and car, whereas computer was lowest priorities. In
2001, cars interest was rose and food was dropped.
In 1971, the majority of spending habits was food, 44% of citizens was foodie wile only 2% of people
preference was computer. A tenth proportion of spending habits had petrol although, a half percentage than food was for cars. Books and restaurants choice was less, likely same 6% and 7% respectively. Choosing furniture for spending time was only below tenth percentage people choice.
After three decades, percentage of cars as spending time was jump up dramatically and percentage
became nearly double. With same proportion foods and restaurants was stood at same position where
we can clearly see the fall in foods. Moreover, for patrol and furniture had no big changes, likely same as in 1971. Small proportion od people had interesting on books, its 1% however, computer as habits for spare time was increased 10%