
The bar chart shows the number of visitors to four London museums. Summarize the information by selecting and reporting the main features and make comparisons where relevant. Write at least 150 words.
 Sample Answer of The Number of Visitors to Four London Museums
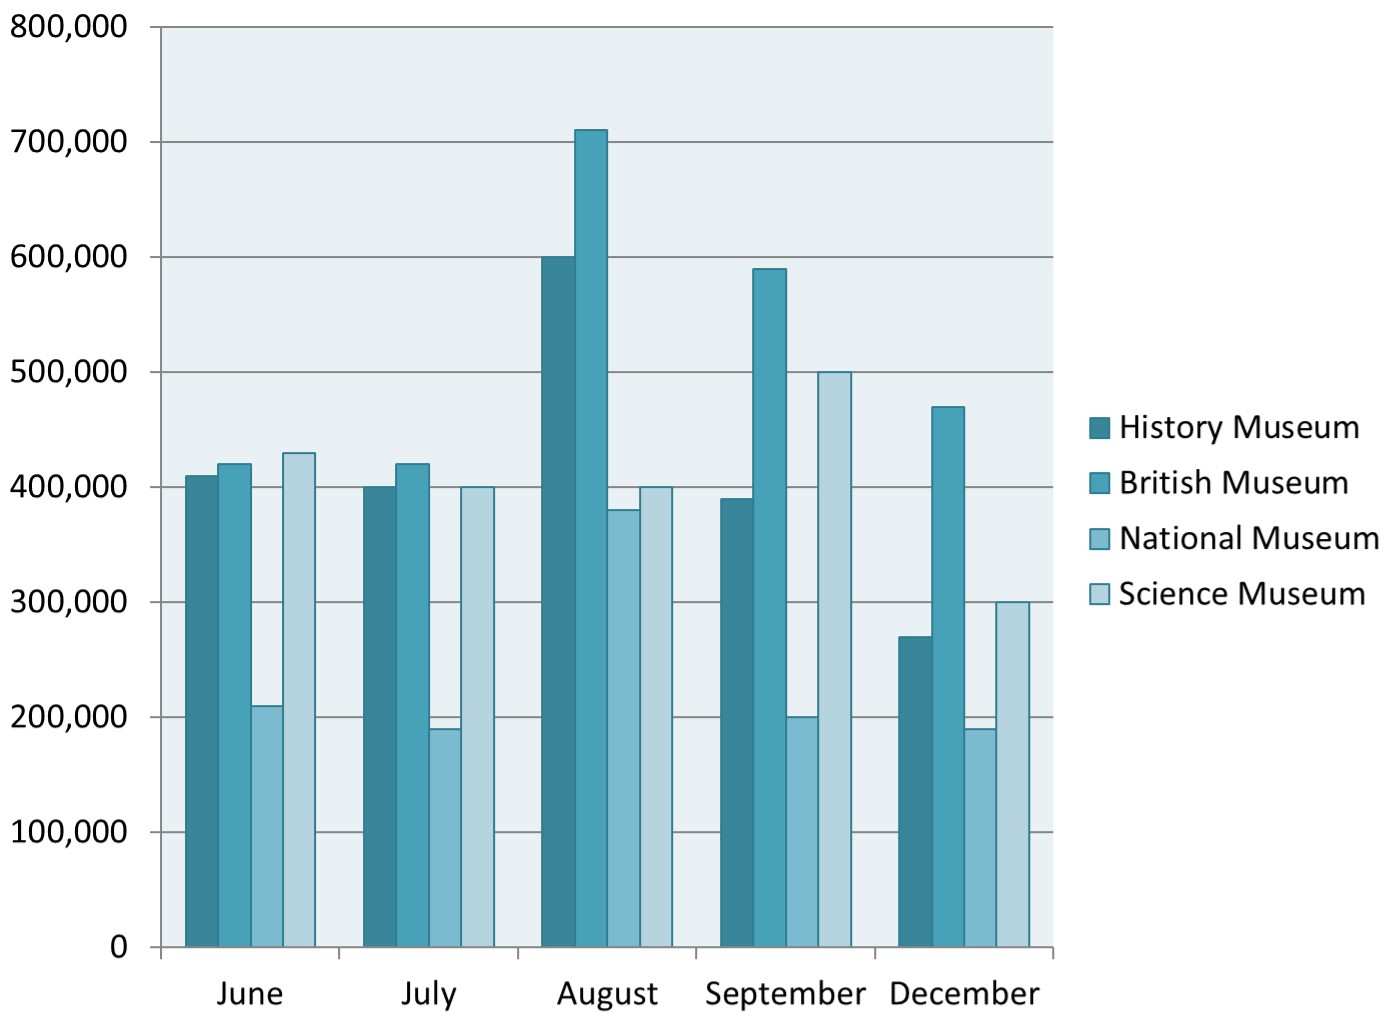
The bar graph represents the number of visitors to 4 London museums.
Overall, British Museum had the highest number of visitors in August compared to all the four museums while the National Museum recorded the least visitors among all and the lowest in December.
British Museum was the most visited Museum among all the four museums and recorded the highest number of visitors of around 70000 in the month of August, and then it saw a gradual decline. In the month of September, the visitor number got down by 100000 which further declined till December and reached at 450000 approximately, but the least visitors were recorded in the month of June and July for almost 400000. History Museum was the second most visited Museum among all the four London museums. It followed a similar pattern as a British Museum, which recorded a monthly high of almost 600000 in August and lowest in the month of December to around 250000.
Turning to the Science museum, it had a peak number of visitors in September around 500,000 and as low as 300,000 in the month of December. It maintained an average of 400,000 for 2 months, June and July. Finally, the National Museum was the most affected Museum by visitors among all the four London museums; it had a consistent number of visitors, approximately 200,000 for the entire seven months and never broke the trend.
Follow us on IELTSFever Instagram.
Also, Read The Bar Chart Below Shows the Percentage of Australian Men and Women
Discover more from IELTS Fever
Subscribe to get the latest posts sent to your email.


