
The pie charts below show the online sales for retail sectors in Australia in 2003 and 2013. Summarise the information by selecting and reporting the main features, and make comparisons where relevant.
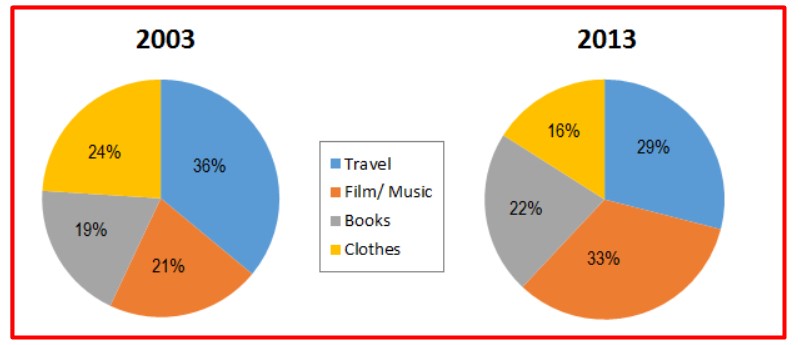
The circular layouts elucidate the online sales of travel, film or music, books and clothes in Australia in two selected years. The data has been calibrated in percentage.
As a general analysis, it can be clearly seen that the sales of travel and film or music decreased after a decade, while books and clothes showed the opposite trend.
Having a glance upon, the online sales of travel depicted the maximum proportion which was accounted as minor more than one-third in 2003, being 7% more than the sales in 2013. Whereas, the online marketing of books sector was undoubtedly least which was noticed as merely 19%. Surprisingly, the figure increased slightly after a period of ten years which was observed as 22%.
Probing ahead towards the clothes, the data of online sales was witnessed as 24% and 16% in 2003 and 2013, respectively. In 2003, 21% of online sales were related to the film or music category. Interestingly, the figure rose to one-third after one decade, making this sector best selling online market.
Follow Us on IELTSFever Twitter for more updates
Discover more from IELTS Fever
Subscribe to get the latest posts sent to your email.


