
The Table Below Gives Information About the Underground Railway Systems in Six Cities. Summarise the Information by Selecting and Reporting the Main Features and Making Comparisons Where Relevant.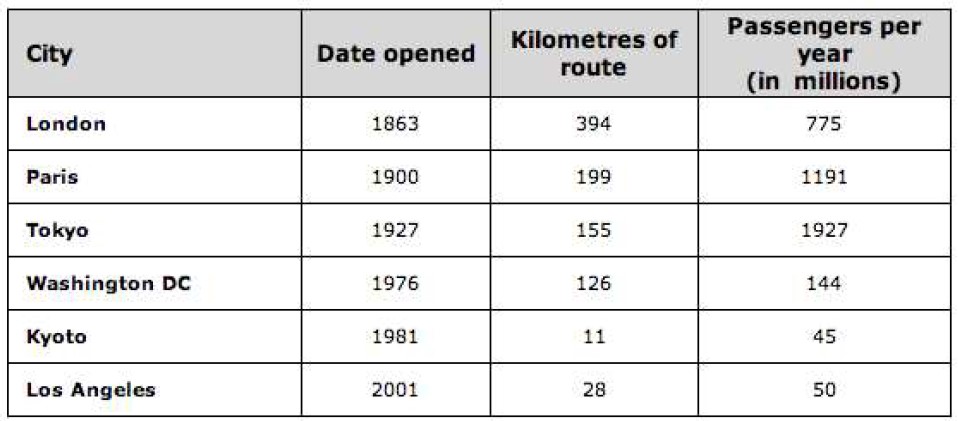
Sample 1: The Table Below Gives Information About the Underground Railway
The bar chart illustrates the intensity of people in 2003 and changes up to 2005. Overall, it shows the number of people present per square km from six different countries and their changes over a couple of years.
It seems that in 2003, the number of people living in Australia and Canada was lesser than in other countries. The number of people per square km in six countries is higher in Japan, followed by the U.K. and Italy. Sweden doesn’t have a higher figure.
Later, from 2003 to 2005, the population percentages of these countries experienced a great deal of change. Australian and Canadian populations increased by 1.42 and 1.06 per cent, respectively. In Contrast, Japan, the U.K., and Italy increased modestly. To be specific, Sweden’s population decreased by 0.1 per cent from 2003 to 2005.
In conclusion, the population density of six different countries drastically changed from 2003 to 2005 per square km.
Follow Us On IELTSFever Facebook Page For More Updates
Sample 2: The Table Below Gives Information About the Underground Railway
The two bar charts illustrate how people were crowded together in 2003 and how the population changed between 2003 and 2005 in Australia, Canada, Japan, Italy, Sweden, and the United Kingdom. The units of measurement are number and percentage.
Overall, it is evident that Japan has the highest density of people while Australia has the lowest number throughout the given period. In comparison, Australia saw a significant rise in population changes, whereas Sweden experienced a dramatic decrease in population.
To begin with, in 2003, Japan and the United Kingdom had the highest number of people living in the country; they were 336 and 243 respectively. This is followed by Italy, whose density was 191. However, Australia and Canada have the lowest number of people living in the country; the number were 2 and 3, respectively
In contrast, from 2003 to 2005, the population changes in Australia and Canada were 1.42% and 1.06%, as opposed to the density in 2003, which was 2 and 3. However, Japan and the United Kingdom, which had the highest population density in 2003, now experienced the least population changes with values of 0.35 and 0.25%, respectively, while Sweden experienced the least population changes with 0.1%.
Discover more from IELTS Fever
Subscribe to get the latest posts sent to your email.


