The table below shows changes in the numbers of residents cycling to work in different areas of the UK between 2001 and 2011. Summarise the information by selecting and reporting the main features and making relevant comparisons.
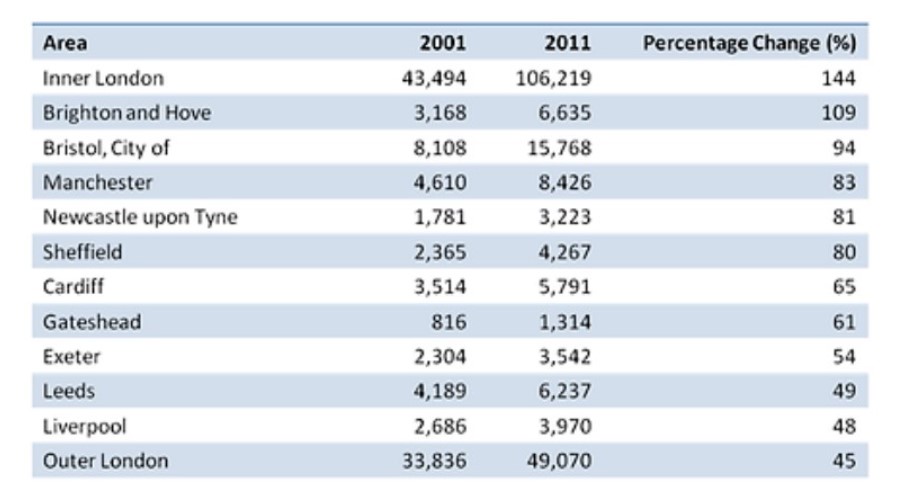
The given table depicts the differences in the number of commuters who cycled to work in the various cities of the United Kingdom between the years 2001 and 2011 expressed percentage-wise as well.
From the data, it can obviously be noticed or deduced that the number of cycles(to work) increased vastly throughout the years across all the cities.
Firstly, Inner London started with the highest record of 43 494 cycling residents in 2001. However, by 2011 the number had surged to 106, 219 creating a significant increasing difference of 144 in percentage. This was followed by Brighton and Have, Bristol City, Manchester, Newcastle, Sheffield, Cardiff, Gateshead, Exeter, Leeds, Liverpool and last but not least Outer London, respectively in decreasing order.
However, Gateshead was the city with the least figure difference, perhaps due to population, yet at the 8th position with 61%.
Interestingly, Outer London with a total difference of about 16, 700 plus increase in cycling workers ended up as the least on the table as evidenced by the record given which is 45%.
Follow Us on IELTSFever Twitter for more updates
Discover more from IELTS Fever
Subscribe to get the latest posts sent to your email.