
The table below shows sales made by a coffee shop in an office building on a typical weekday. Summarise the information by selecting and reporting the main features and make comparisons where relevant.
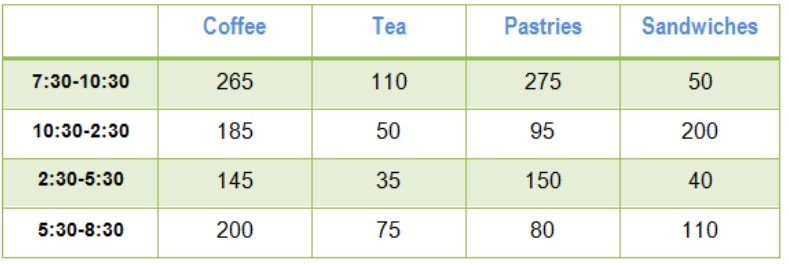
The tabular chart delineates the information regarding the cafe that sells foods and drinks, especially coffee, tea, pastries, and sandwiches, in the office on business days.
Looking for an overall perspective, it is readily apparent that in the morning, the sale of pastries surpassed all other food and drink items, whereas, between 2:30 and 5:30, tea sales declined.
After analysing the details, it is evident from the chart that at breakfast time, from 7:30 to 10:30, the sales of pastries reached 275 and 265 people preferred coffee. In the afternoon, the sales of pastries declined, which accounted for 95, and the sales of coffee also showed a downward trend, which was 185.
Meanwhile, in the evening, the sales of pastries increased gradually by 55, and sales of coffee again declined and were recorded at 145. In contrast, at dinner time, the sales of pastries showed a downward trend, and coffee sales showed an upward trend.
Moving towards the rest of the items, tea and sandwiches, in the morning time, the sales of tea and sandwiches were 110 and 50, respectively. However, the sales of tea followed a downward trend in all periods except 5:30 to 8:30, and the sales of sandwiches followed an upward trend in all periods except the evening.
Subscribe to Us On the IELTSFever YouTube channel For Tips And Tricks and Real Exam Tasks
Discover more from IELTS Fever
Subscribe to get the latest posts sent to your email.


