
The table below shows social and economic indicators for four countries in 1994, according to United Nations statistics. Describe the information shown below in your own words. What implications do the indicators have for the countries?
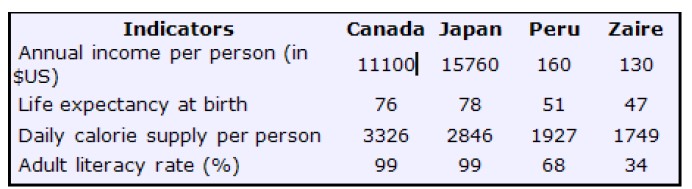
The table illustrates that, according to US figures, the number of the economic and social index in four different nations in the year 1994.
Overall, it is immediately apparent from the graph that the annual income of Japanese natives had maximum pay rates in US dollars instead of others, but Peru and Zaire had the least annual income per person in US dollars.
In detail, according to the index, Canada gave maximum annual income per person, with shares at 15760. Similarly, Canada also followed a positive trend with the lowest pay annual salary per person, which accounted for 48600 lesser than Japan. Moreover, life expectancy at birth was slightly similar between Canada and Japan, with shares at almost 78 and 50 in Peru in the year 1994. Whereas the ratio of annual income per person captured had the lowest income at 100 in Peru, in the case of Zaire, this number plummeted by US$30.
Furthermore, according to US statistics, the barometer of individuals from Canada consumed more daily calories than others with shares 3326, and this value got declined by 520 in Japan in the year 1994. However, the daily calories supply per person in Peru and Zaire had a different numbers, which were recorded in 1927 and 1749. It is interesting to note that Canada and Japan had the same adult literacy rate at 99%, but Peru’s percentage got plunged by 28% and 75% in Zaire.
Follow Us on IELTSFever Twitter for more updates
Discover more from IELTS Fever
Subscribe to get the latest posts sent to your email.


