


The two pie charts below show some employment patterns in Great Britain in 1992. Summarize the information by selecting and reporting the main features, and make comparisons where relevant.
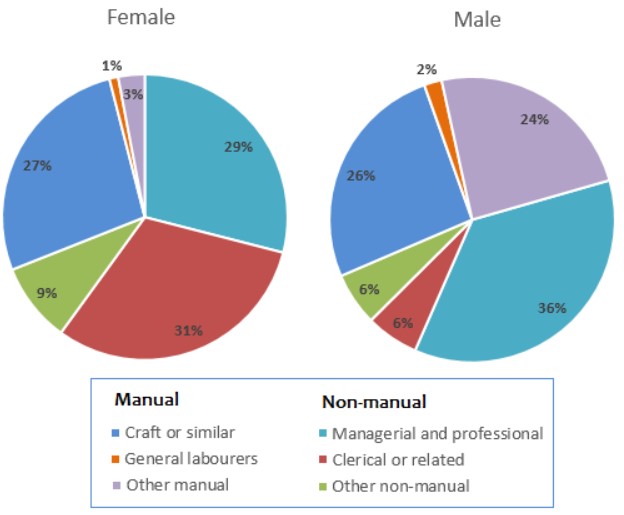

The illustration represents the employment pattern in Great Britain in 1992 with two categories and six subcategories for males and females. The categories are Manual and Non-manual, in which the manual category consists of craft or similar, general labourers, and other manual work, while the non-manual category consists of managerial and professional, clerical or related, and other non-manual work.
From the chart of female and male, we can see that female employee prefer clerical or related work, while managerial work and craft work obtain second and third position respectively. Hence, female employees do mainly non-manual work. By comparing with male employee patterns, they are doing more manual work than non-manual—however, managerial and professional work is done by majorly males.
The craft or similar work is done by almost the same percentage by both males and females. The clerical or related work done by the male is only 6% while in case of female percentage it is almost one-third of the whole female employment type. Female employees do only 1% of general labourers work, and males do 2%, for both of them this work is the last one.
Follow Us on IELTSFever Twitter for more updates
Also read: The Pie Chart Below Shows Energy Is Used in a Typical Australian