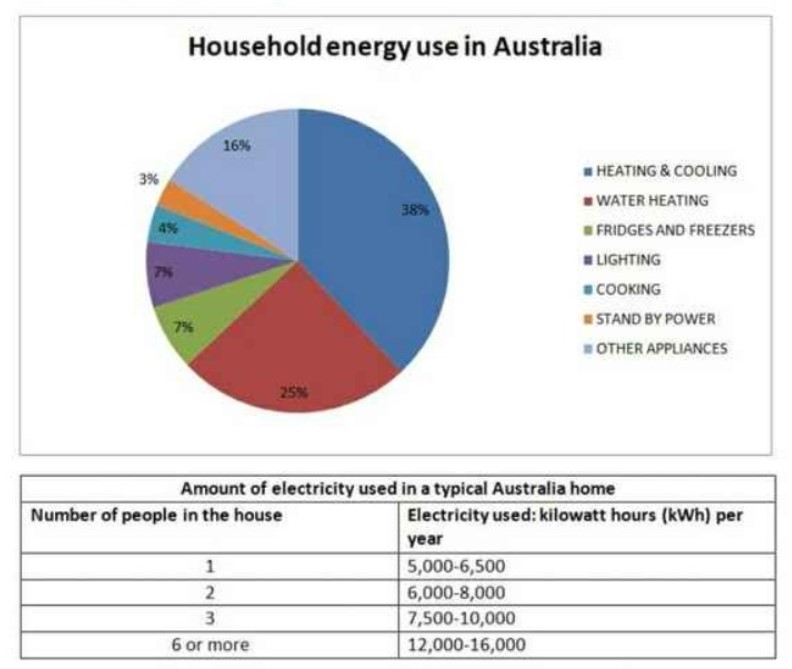
The pie chart below shows where energy is used in a typical Australian household, and the table shows the amount of electricity used according to the number of occupants. Summarize the information by selecting and reporting the main features, and make comparisons where relevant.
Sample Answer of The pie chart below shows where energy is used in a typical Australian household.
The pie chart projects the diversified use of electricity in a typical Australian household while the table compares its usage according to the number of users.
Overall, a large amount of energy is used for heating purposes while the consumption increases with an increase in the number of occupants.
According to the graph, a large amount of energy was spent on heating and cooling the houses, which is nearly 38% of overall electricity consumed by a user yearly but under for the classified use of it water heating consumes 25% early. In comparison, fridges and freezers drew 7 % electricity yearly. The third-largest area of energy consumption was other appliances, around 16% at homes.
The rest of the small areas of usage like lighting, cooking and standby power which utilised 7% 4% and 3% respectively annually. The energy consumption increased with the number of users like an individual consuming around 6.5-kilowatt-hour energy, whereupon 2 occupants consumed 8 kilowatt-hours. Similarly, 3 occupants consumed 10-kilowatt hours And 6 and more consumed around 16-kilowatt hours annually in Australia.
Follow Us on IELTSFever Instagram for more Updates And the Latest test tasks.
Also, Read TIP (2) ACADEMIC WRITING TASK 1 Tips for Line graph.
Discover more from IELTS Fever
Subscribe to get the latest posts sent to your email.

