Post
The Chart Below Shows the Changes that Took Place in Three Different Areas of Crime
The chart below shows the changes that took place in three different areas of crime in Panama City from 2010 to 2019. Summarise the information by…
The chart below shows the changes that took place in three different areas of crime in Panama City from 2010 to 2019. Summarise the information by…
The charts below show the main reasons for study among students of different age groups and the amount of support they received from employers. Summarise the…
The following diagram shows how greenhouse gases trap energy from the Sun. Write a report for a university lecturer describing the information shown in the diagram.…
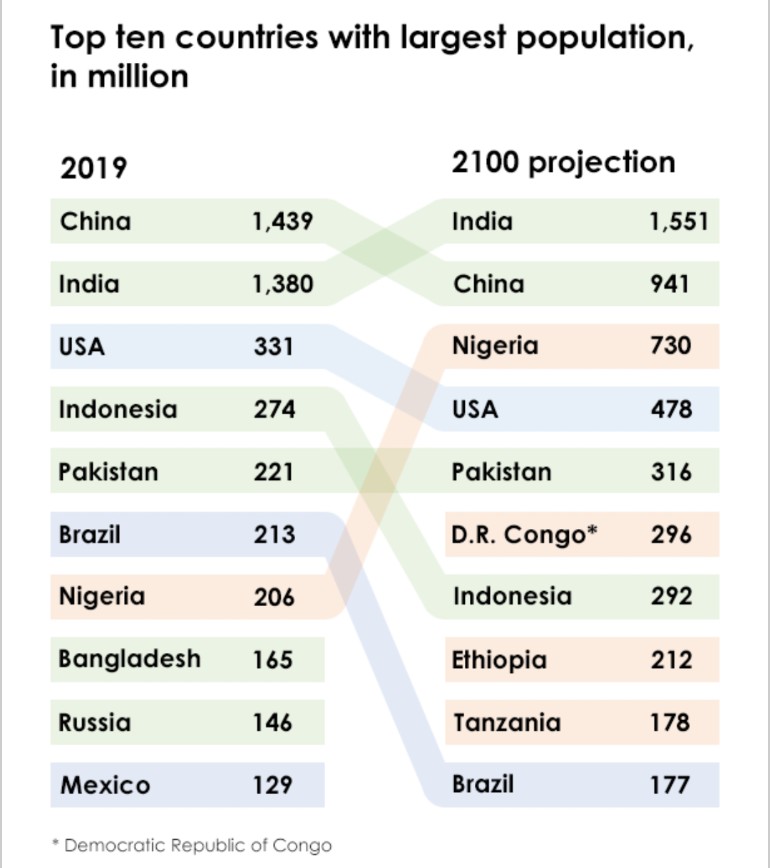
The table below shows the top ten countries with the largest population in 2019, and how it is projected to change by 2100. Summarise the information…
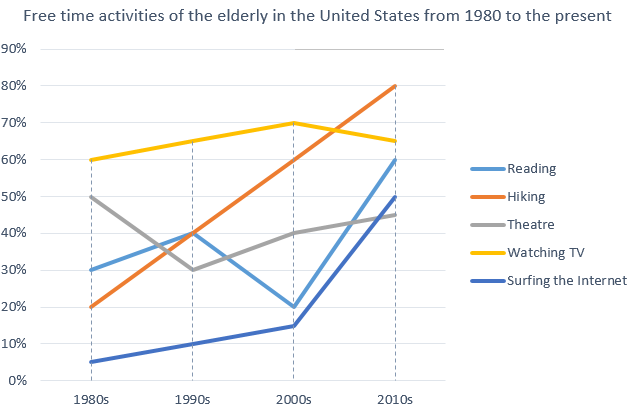
The graph below shows how elderly people in the United States spent their free time between 1980 and 2010. Summarise the information by selecting and reporting…
The charts below show the percentage of the energy generate from different resources in a country in 1985 and 2003. To summarize information by selecting key…
The chart below shows the changes that took place in three different areas of crime in Panama City from 2010 to 2019. Summarise the information by…
The bar chart below shows the average duration of housework women did (unemployed, part-time employed, and full-time) when compared to men who had full-time work in…
The chart below shows how much money is spent in the budget on different sectors by the UAE government in 2000. Summarize the information by selecting…
Compare the amount of electricity generated in Scotland by energy source for 29 years ago and last year. Summarise the information by selecting and reporting the…
The Table Below Shows the Numbers of Visitors to Ashdown Museum during the year before and after it was refurbished. The charts show the result of…
The diagram below gives information about the recycling of glass and plastic containers. Summarise the information by selecting and reporting the main features and making comparisons…