The Table Below Shows the Numbers of Visitors to Ashdown Museum during the year before and after it was refurbished. The charts show the result of surveys asking visitors how satisfied they were with their visit, during the same two periods. Summarise the information by selecting and reporting the main features, and make comparisons where relevant.
Sample Answer of The Table Below Shows the Numbers of Visitors to Ashdown Museum
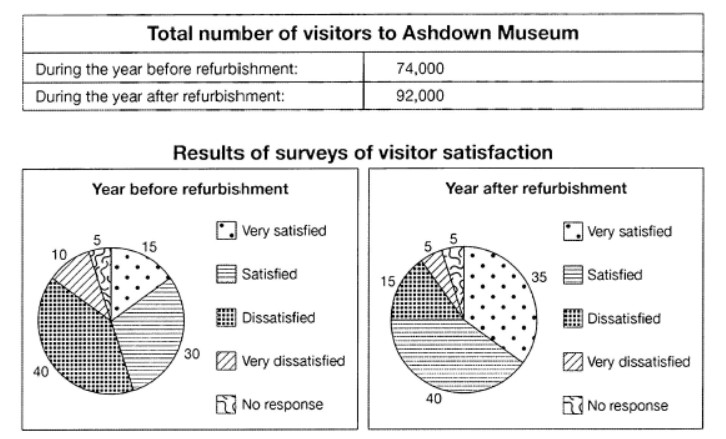
The tables compare the number of visitors who visited the Ashdown museum before and after the restoration. Whereas the pie charts display the information of survey done on visitors during the same two years.
Overall, the number of visitors and ratio of very satisfied visitors has been drastically increased post refurbishment of museum.
To begin with, 74000 visitors have seen the museum when it was in its original state and post refurbishment the number was increased by 18,000 to 92000.
As per pie chart data before the restoration more than two-third of visitors were dissatisfied and very dissatisfied which accounts for 40 and 30 per cent respectively. On contrary to this only one-fourth of visitors were satisfied and very satisfied which parts around 10 and 15% whereas the people who have not participated in the survey were standing at 5%.
Post refurbishment of the museum there was an increase in the ratio of visitors who were satisfied and very satisfied and account 35% and 40% respectively. The number of visitors who were dissatisfied reduced to 15% and only 5% people were very dissatisfied which was equal to the number of visitors who have not participated.
Follow Us on IELTSFever Twitter for more updates and the latest news.
Also, Read The Bar Charts Below Provide Information About Honey Production
Discover more from IELTS Fever
Subscribe to get the latest posts sent to your email.


