The flow chart below the recycling procedure of glass bottles. Summarize the information by selecting and reporting the main feature, and make comparisons where relevant..
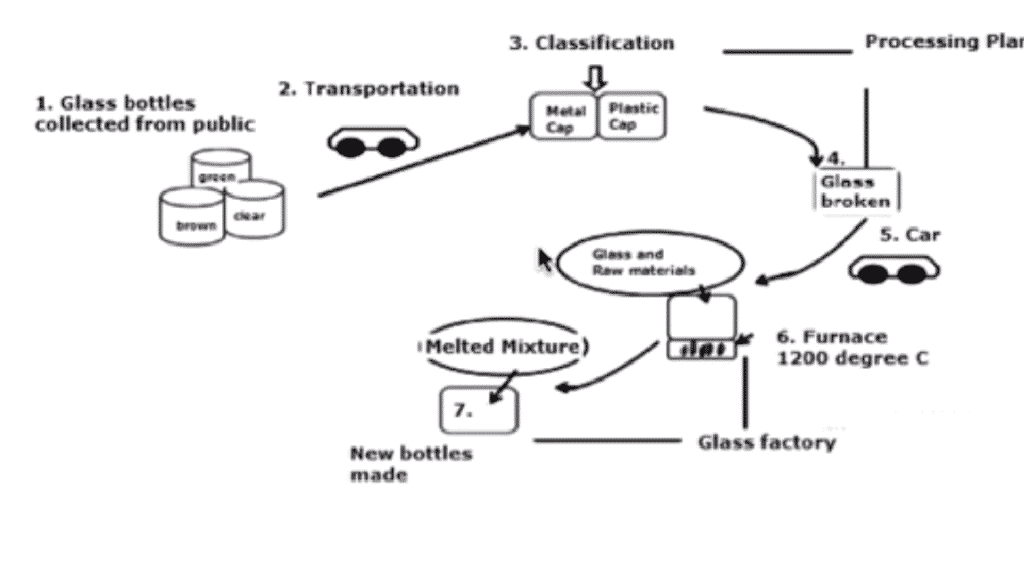
The flow chart below the recycling procedure of glass bottles. Summarize the information by selecting and reporting the main feature, and make comparisons where relevant. The process chart depicts the recycling progress of glass bottles in different stages which are given in the chart. the first step of recycling where glass bottles collected by public […]