
The table below describes percentages of home-schooled students in SomeCountry in 1999-2004. Write a report for a university lecturer describing the information shown.
 This table shows homeschooled students in some countries in the years 1999-2004 in percentages.
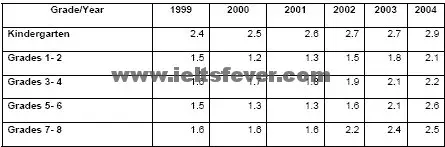
The main trend is that all grades including kindergarten are growing every year. Kindergarten started highest at 2.4 and ended with a percentage of 2.9 per cent with a constant increase. But grades 1-2 and grades 5-6 show a little different trend, both started at 1,5 per cent in 1999 and declines (declined) a little bit in 2000. Both of them increased slowly in 2002 and both held that course to 2004 when grades 1-2 reached 2,1 percent and grades 5-6 reached 2.6 percent.
Grades 3-4 had a slow but steady growth throughout all six years. It started at 1.6 per cent in 1999 and increased by 0.1 every year except in 2003 when it peaked at 0.2 per cent. Grades 7-8 started at 1.6 per cent and stayed there for three years until it rapidly rose to 2.2 and peaked at 2.5 in 2004.
Overall, all grades including kindergarten have had a rise at roughly a minimum of 1 percent and more in 6 years.
Follow Us On IELTSFever Facebook Page
Discover more from IELTS Fever
Subscribe to get the latest posts sent to your email.


The table illustrates the percentage of home schooling in a country for grades below 9 during 1999 and 2004.
It is clearly evident from the graph that kindergarten enrolments were found to be proportionally highest among the given grades. The figures in 1999 were 2.4% which was highest in the year, and it increased gradually every year to 2.9% in 2004, which was the highest recorded. Similarly, grades 3-4 had a steady increase from 1.6% in 1999 to 2.2% in 2004.
Whereas the figures in grades 1-2 (1.5%) in 1999 were found to be comparatively lowest during the given period and were inconsistent for the next two years before rising slowly to reach 2.1% in 2004. Similar pattern was observed among grades 5-6 where the figures started at 1.5% in 1999 which dropped in the next two years after which it increased substantially to 2.6% in 2004.
However, the figures were constant at 1.6 % for three years after which it shifted steadily to 2.5% in 2004 for grades 7-8.
Overall trend for home schooling seems to gain more popularity particularly among the kindergarten and figures tend to be in direct proportion to the number of years.
Good
in which band u give this task 1