Post
The Graph Below Shows the Number of Hours per Day
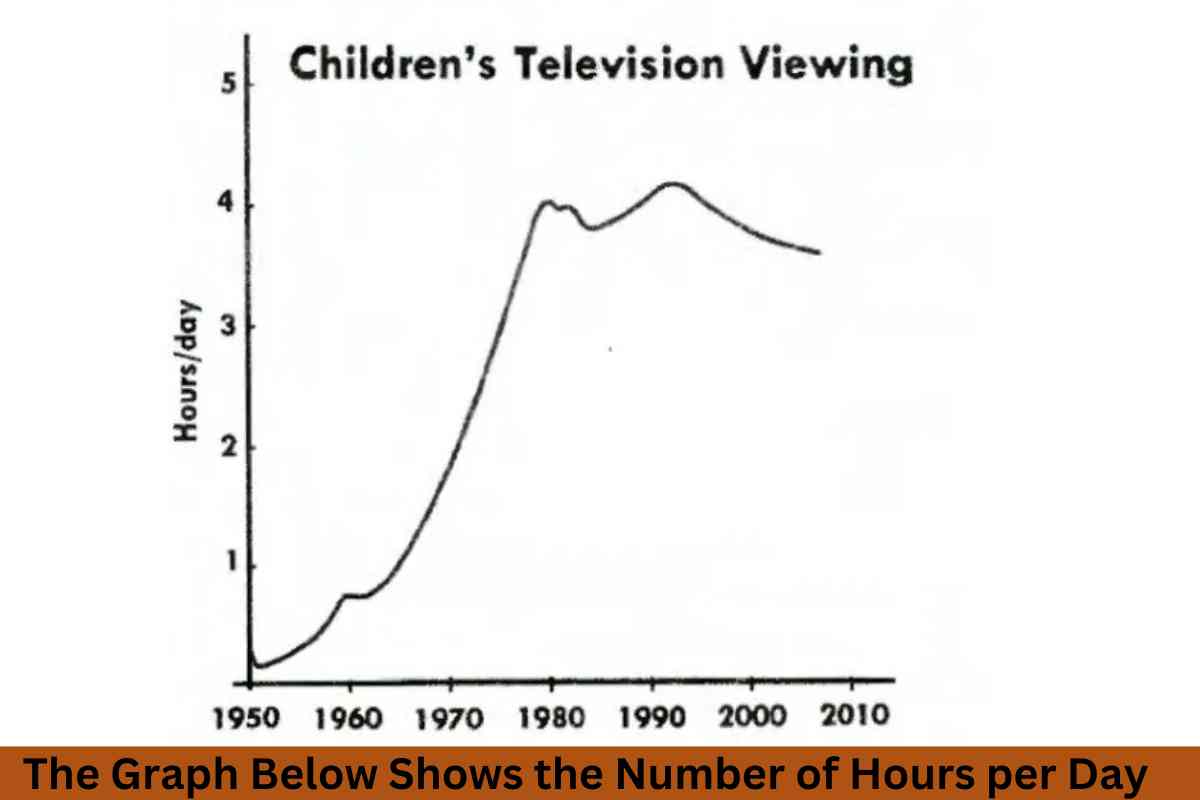
The Graph below shows the number of hours per day on average, that children spent watching television. Summarise the information by selecting and reporting the main…
The Graph below shows the number of hours per day on average, that children spent watching television. Summarise the information by selecting and reporting the main…
The graph below shows the number of hours per day on average that children spent watching television between 1950 and 2010. Summarise the information by selecting and…
Nowadays, more and more people decide to have children later in their life. What do you think are the reasons for this? Do the advantages of…
More people decided to have children at a later age than in the past. Why? Do the advantages of this outweigh the disadvantages? Give reasons for…
IELTSFever FREE Online Practice Test Day 6 SOLVED Must Read This Instructions before participating in Exam The answer to each and every question is mandatory otherwise…
Hand-writing has become less formal and it is done in a more relaxing way, now than in the past. What are the causes? There are more…
‘Children do not respect their parents as much as they did in the past. this behavior is now having a negative impact on society’. discuss. Ans:…
Some people believe that children should be given too much free time. they feel that this time should be used to do more school work. how do…
Some people believe that children should be allowed to stay at home and play until they are six or seven years old. others believe that it…
Some governments say how many children a family can have in their country. they may control the number of children someone has through taxes. it is…
Some people believe that children’s leisure activities must be educational otherwise they are a complete waste of time. do you agree or disagree? give reasons for…
Urban areas are witnessing an increase in obesity among children. suggest some solutions to solve this problem. Ans: It is certainly true that cities localities are…