The Bar Chart Shows the Scores of Teams a, B, and C Over Four Different Seasons.
Summarize the information by selecting and reporting the main features and make comparisons where relevant.
You should spend about 20 minutes on this task.
Sample Answers of the AC Writing The Bar Chart Shows the Scores of Teams a, B, and C Over Four Different Seasons.
Sample 1
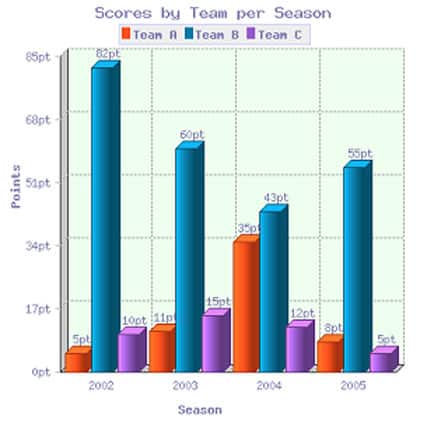
The bar chart illustrates the points of teams A, B and C in four seasons. Overall when seeing the chart it clearly states the different team performance in the year of 2002,2003,2004,2005. Consistently, Team B is the only team who has scored more compared to other teams in all the seasons. Which makes them as the winner of all the seasons. Apart from that Team A has shown an inclination in the year 2004.
When we look into the graph for the year 2002-2003 season. In 2002 It’s very evident that Team B scored 85 points compared to Team A and C who scored 5 and 10 points respectively. However, in the next season in the year 2003, Team B point is been declined to 60, but other two teams A and C point inclined to 11 and 15, Which is a steady growth of both teams. Though they have scored better points compared to the earlier season which doesn’t make them win the season. As Team B is still at the peak.
When we compare the season 2004 and 2005, In Season 2004 Team B scored has declined and scored 43 points compared to the earlier 200 seasons. However, Team A has shown a very good performance and it has scored 35points which almost neared the score of Team B. Team C has declined to 12 points compared to 2003 season. In season 2005 the bar chart shows a declination in the points of the Team A and C which is 8 and 5, Though Team B has slightly inclined compared to the last season scored 55 points. Thus Team B secured all the seasons by scoring higher points than other teams, Though there were fluctuations in between.
Sample 2
The Above Bar Chart illustrates the scores of three different items (Team A, B & C) per season.
t first glance, it is clear that Team B recorded the highest point 82point in the year 2002.
Overall, it is noticeably clear that in both years 2003 and 2005, 60 points and 55point was recorded by team B respectively while 35point and 43point were recorded by team A and B in the year 2004.
However, in 2002, 2003, 2004 and 2005 team C recorded, the lowest point which was 10point, 15point, 12point and 5point respectively while the least low point 5point, 11point, 8point was recorded by the years.
So These are the Sample answers of AC Writing (The Bar Chart Shows the Scores of Teams a, B, and C Over Four Different Seasons.)
Discover more from IELTS Fever
Subscribe to get the latest posts sent to your email.