
The Chart Below Gives Information About European People of Different Age Groups Who Went to The Gym Once a Month or More, Between 1990 and 2010. Summarise the Information by Selecting and Reporting the Main Features, and Make Comparisons Where Relevant.
 Sample 1: The Chart Below Gives Information About European People of Different Age Groups Who Went
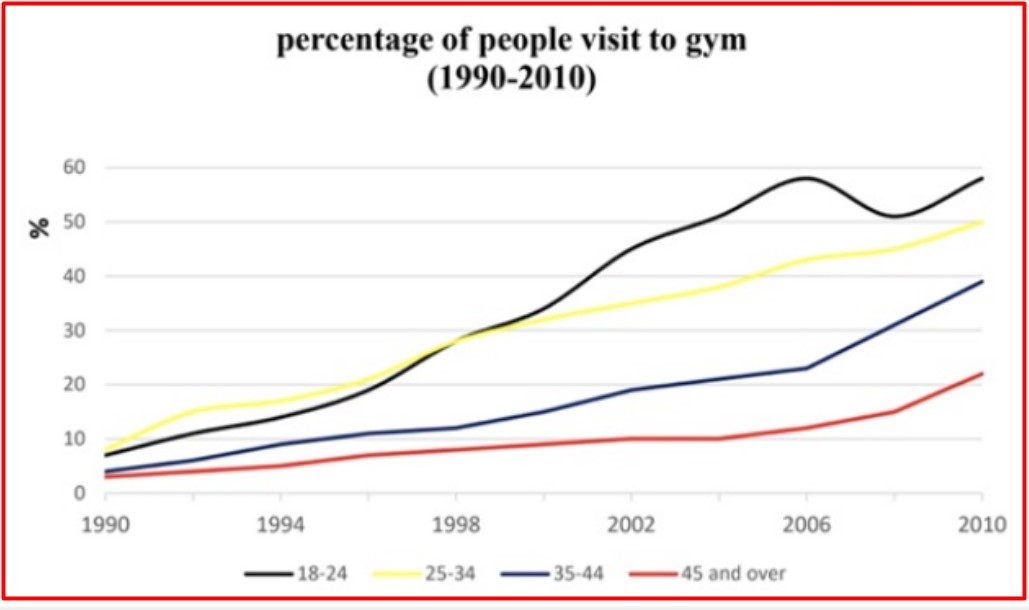
The line graph represents the data on the percentage of people categorised according to their age, who visited the gym once a month or more from 1990 to 2010.
Overall, it is clear from the graph that the percentage of people in all age groups who attend the gym increased over time. Moreover, the percentage of people from the smallest age group was the highest amongst all in 2010.
To initiate at, in all age groups, the figure of people visiting the gym was below 10% in the year 1990. The percentage of people between the ages of 18 and 24 continuously increased and accounted for around two quarters in 2002. This trend further rose till 2006 and then slightly fluctuated in 2008. However, adults, from the 25 to 34 age group, had the highest ratio in 1990, which steadily increased and had more than 40 per cent of people who went to the gym after 2002. In 2010, half of the people from the same group went to the gym.
Moreover, the percentage of people between 35 and 45 years old steadily went upward, and 20% of people visited the gym in 2006, which increased by 10% after 4 years. However, till 2004, only 10% of people aged 45 or older joined the gym, which climbed to 20% in 2010.
Follow Us on The Facebook IELTSFever Page For more updates
Discover more from IELTS Fever
Subscribe to get the latest posts sent to your email.


