The chart below shows the average daily minimum and maximum levels of two air pollutants in four big cities in 2000. Summarise the information by selecting and reporting the main features and making comparisons where relevant.
Sample Answer of The Chart Below Shows the Average Daily Minimum and Maximum Levels of Two Air Pollutants in Four Big Cities in 2000
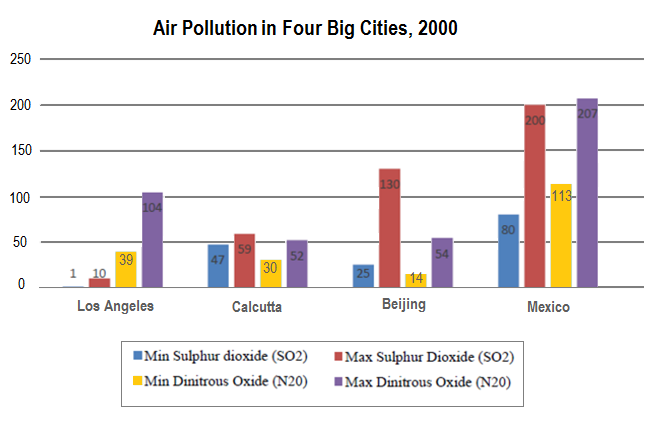
Presented in the illustration is the bar chart that lowest and highest levels of two kinds of air contaminants among 4 cities, namely Los Angeles, Calcutta, Beijing, and Mexico, in 2000.
Overall, it is clear that the level of pollution in Mexico is worse and more serious than in other towns.
To illustrate, the rate of Sulphur in the air of Los Angeles ranged from merely 1 to 10, which was remarkably lower than that of the aforementioned cities. Meanwhile, Mexico had the highest level of this pollutant which varied from 80 to 200 in 2000. Although the minimum level of SO2 was 47 and 25, respectively, in Calcutta and Beijing, the maximum range went up to 130 in the latter town, which was almost double the figure of the former one.
With the second pollutant, Mexico continued to be dominant with the maximum level at 200, which was almost ten times higher than Beijing and four times higher than the data of Calcutta and Los Angeles. At the same time, the upper level of N2O was in Los Angeles higher than Calcutta and Beijing.
Follow Us on IELTSFever Twitter for more updates
Discover more from IELTS Fever
Subscribe to get the latest posts sent to your email.


