
The chart below shows the changes that took place in three different areas of crime in Panama City from 2010 to 2019. Summarise the information by selecting and reporting the main features, and make comparisons where relevant.
Sample Answer of The Chart Below Shows the Changes that Took Place in Three Different Areas of Crime
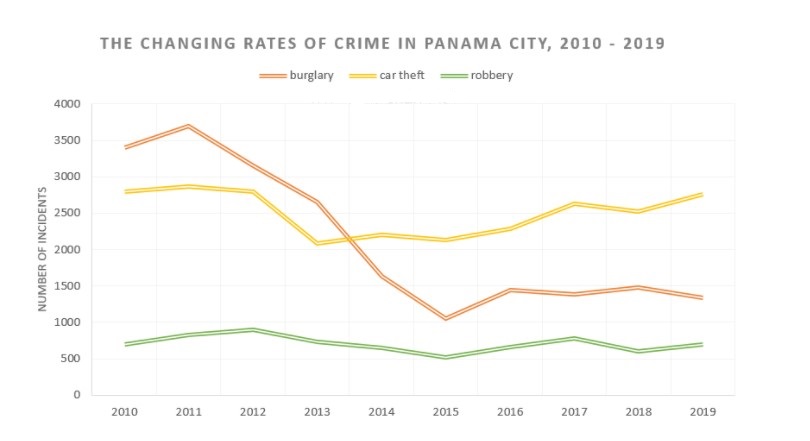
The evolution in the various types of crime in the city of Panama between 2010 and 2019 is rendered by the chart. The data is calibrated in the number of events per year.
To begin with, In 2010, Burglary was the highest in terms of number with around 3400 events. In a subsequent year, A slight rise of about 3800 cases was observed. Further, The rate of Burglary was declined drastically to only 1000 complaints by 2015. Then over a year, a small jump was seen nearly to 1500, but in the following years there was no noticeable change had occurred.
A considerable drop was noticed in the case of car theft from well above 2500 in 2010 to just above 2000 in 2013. Over the next six years, The events of car theft increased steadily from slight over 2000 to roughly 2800.
It is a noteworthy point that there had been no difference seen for robbery in a decade over the time; it showed fluctuating behaviour in the pattern of robberies.
Overall, It is evident that there was a significant slip was happened for Burglary, but in the other two cases of offence, no clear shift did see and stayed bounded in a particular range. By 2019, car theft become a highly offensive activity.
Follow Us on IELTSFever Twitter for more updates
also Read Some People Think that If a Country Is Already Rich, Any Addition in Economic Wealth
Discover more from IELTS Fever
Subscribe to get the latest posts sent to your email.


