The Chart Below Shows the Number of Registered Road Vehicles in Use in A European Country in 1996 and 2006. Summarise the Formation by Selecting and Reporting the Main Features and Making Comparisons Where Relevant.
Sample Answer: The Chart Below Shows the Number of Registered Road Vehicles in Use in A European Country in 1996 and 2006
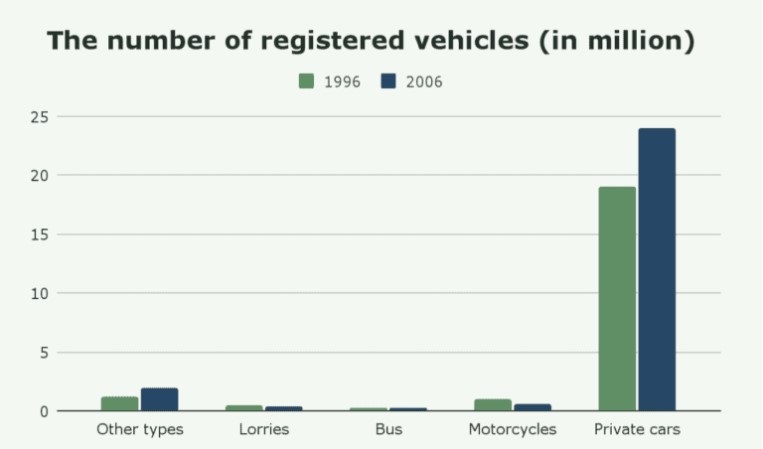
The diagram shows the number of registered vehicles in operation in a particular European country in the years 1996 and 2006. The vehicles were classified in five groups: Private cars, Motorcycles, Buses, Lorries and Other types.
According to the graph, the category with the highest number of registered vehicles was Private cars. In 1996 alone, close to 20 million vehicles were registered, whilst in 2006, close to 25 million vehicles were registered.
The second-highest number of registered vehicles was in the Other types group, but it was still well below the highest number. The second group recorded fewer than five million vehicles.
The categories with the fewest registered vehicles were lorries and buses. In both years under review, the number of registered vehicles under these categories was less than three million.
From the graph, aside from the Private cars category, none of the other groups reached 5 million registered vehicles.
Follow Us on The IELTSFever Facebook Page for more updates
Discover more from IELTS Fever
Subscribe to get the latest posts sent to your email.


