 Sample 1:-The Chart Below Shows Waste Collection by A Recycling Center from 2011 to 2015

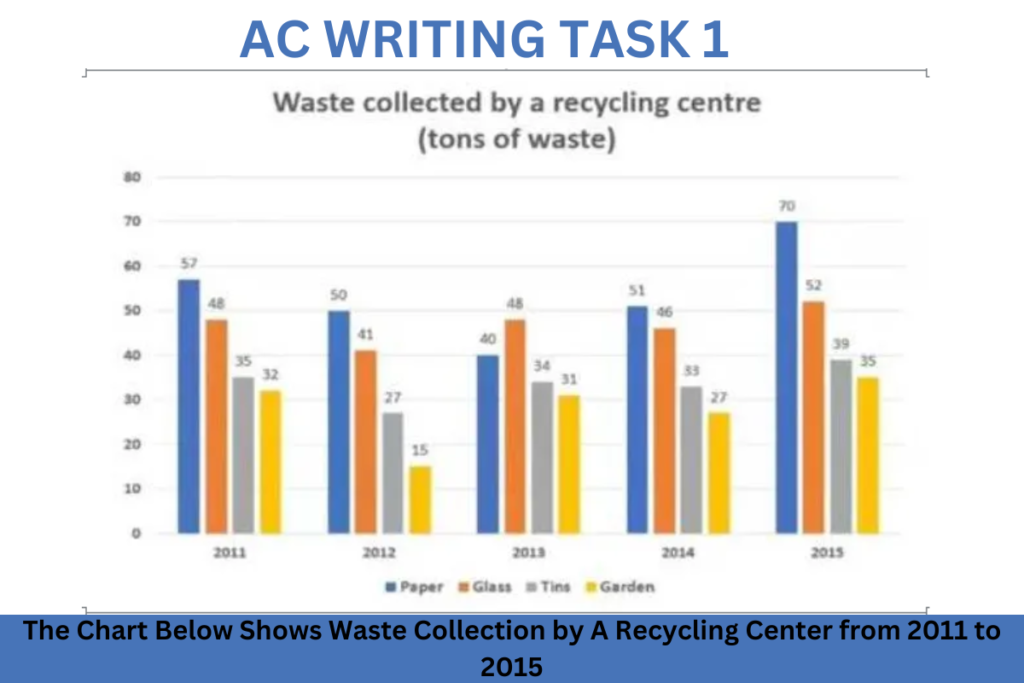
The Chart illustrates information about the waste collection of paper, glass, tins, and garden waste by a recycling center from the year 2011 to 2015.
Overall, the refuse that consisted of paper was the highest collected in all the years except in 2013. While garden refuse was the least gotten throughout the years by the recycling center.
In the year 2011, paper and glass refuse surpassed its collection in the following year with 7 tons each. While refuse gotten from tins and gardens was 35 tons and 32 tons, the next year, there was a decline in the waste collected. The tins had 27 tons, while the garden was less than half which was 15 tons.
During the 3 years period from 2013 to 2015, there was a significant increase in the number of waste obtained from paper. The glass waste accounted for 48 tons, 46 tons, and 52 tons in the three years, respectively. Whereas the litter gotten from tin had 34 tons, 33 tons, and 39 tons each. Similarly, the garden litter also had a low amount of 31 tons, 27 tons, and 35 tons, respectively, throughout the years.

Sample 2:-The Chart Below Shows Waste Collection by A Recycling Center from 2011 to 2015
The bar graph depicts four kinds of waste collected by a recycling center from 2011 to 2015—units of measurement in tons. Overall, it is clear that paper was the highest waste taken while garden waste was the least collected over the entire period.
To commence, in 2011, paper was the most waste collected, recorded at 57, followed by glass at 48 as well as tins and gardens at 35 and 32, respectively. However, the trend remained the same in 2012, but the values declined in all the waste types.
Furthermore, the figures fluctuated over the following years, making paper waste to dropped to 40 in 2013 and finally inclined to 70 in 2015. Meanwhile, the other wastes surged in the latter year, recording 52,39, and 35 for glass, tins, and garden, correspondingly.
Discover more from IELTS Fever
Subscribe to get the latest posts sent to your email.


I want to clear the exam can you please help regarding this