


The chart shows the number of mobile phones and landlines per 100 people in selected countries. Write a report for a university lecturer describing the information given.

The bar graph gives the information about the individuals using mobile phones and landlines in different countries among hundred people.
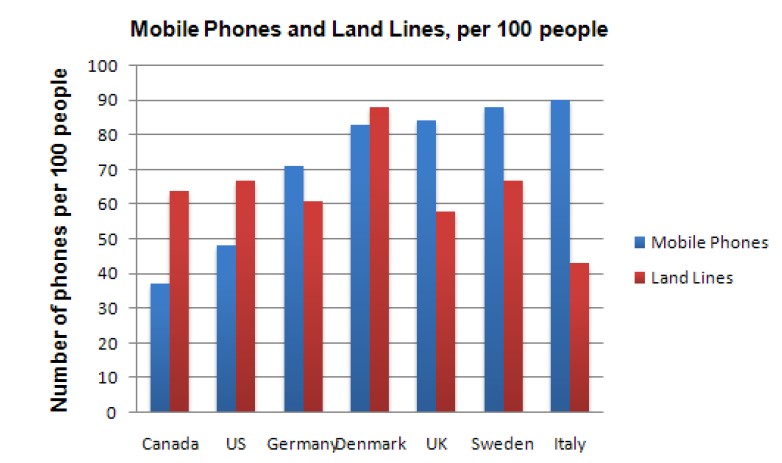
It shows that the trend of using mobile phones is greater than the landline, but in Canada, US and Denmark, people use more landlines than mobile phones. In Italy, mobile phones are used by people at the maximum rate, but in Canada, it’s used least, but in Denmark near about 90% of people use a landline, and the least used is in Italy.
With the advance in technology, people use more mobiles in different countries have different proportions. In Italy, 90 people use mobile out of 100, which is the maximum rate. In Canadians used minimum rate of usage of mobiles about 37%. Sweden UK Denmark German and US people using mobile in descending order about 87, 84, above 80, above 70 and less than 50 respectively of 100 people.
Whereas landline usage shows different trends among different countries, its usage trend is so low. In Denmark, the maximum number of people is near about 90 out of 100, and in Italy, the lower number of people use about 43 use landlines. In Canada, the US, Germany, Sweden, landline usage range between 60 to 67, but UK people use about 57 out of 100 people.
Follow Us on IELTSFever Twitter for more updates