
The Graph Below Shows Radio and Television Audiences Throughout the Day in 1992.
Summarise the information by selecting and reporting the main features and make comparisons where relevant.
Sample Answer of The Graph Below Shows Radio and Television Audiences Throughout the Day in 1992
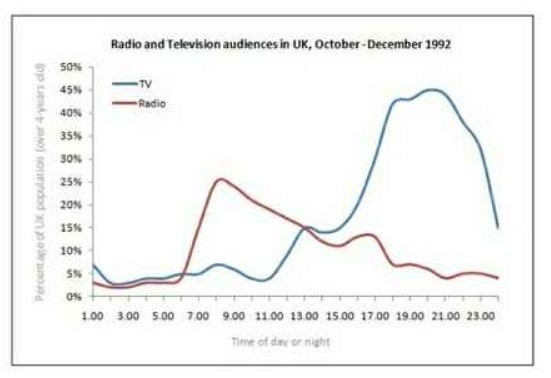
The given line graph elucidates about people who are watching television and listening to the radio throughout the day in the UK in 1992.
Overall, it can be seen that majority of the people watch television at night time, after 9 pm it fell sharply. However, individuals use the radio mostly in the morning hours.
It is interesting to note that in 1992, at 1:00 am around 7% of people watch television and is higher than radio, which accounted under 5%. The radio audience showed a rapid increase at 6 A.M. from 4% to reach a zenith of 25% at 7 am. In the meantime, television viewers fluctuated. Then, after 11 am people who watch television rose gradually to 15 % and had experienced a slight fall, which increased significantly to reach an apex point of 45% at 21:00 whereas it goes down after 22:00 to less than 15%. On the contrary, radio
listeners decreased relatively until 15:00, it shows a minimal climb to above 10%. Ultimately, it has touched a trough of below 5% at 23:00.
Also, Check
Percentage Participation of Women in Senior Management in Three Companies
Discover more from IELTS Fever
Subscribe to get the latest posts sent to your email.


