
The graph below shows the average class size in six countries and compares it with the world’s average class size in 2006. Summarise the information by selecting and reporting the main points and give comparisons where relevant.
 The Graph Below Shows the Average Class Size in Six Countries and Compares It with The World’s Average Class Size in 2006
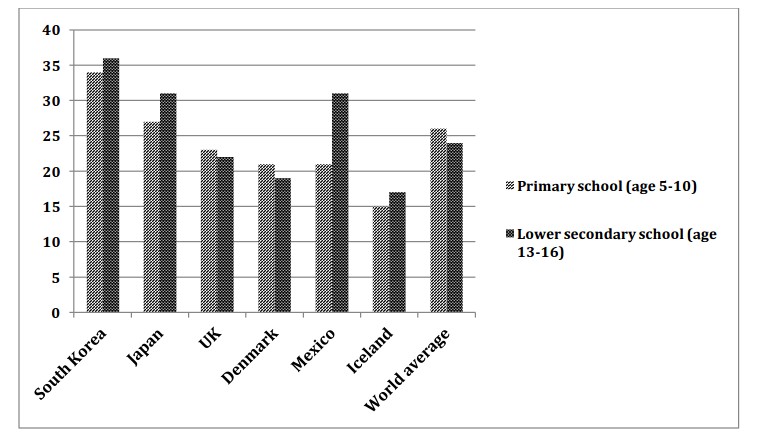
The bar graph illustrates the information about the percentage of children at the primary school and lowest secondary schools of different age groups in six Nations and also the world average in 2006.
According to the chart, the proportion of south Korean primary students had less secondary school, 34% and 38%, respectively. At the same time, Japan was 26% of the student average in primary academy whereas secondary school figure was 32%. Meanwhile, 15% of primary children in Iceland and 17% in the lower secondary institute.
On the other hand, UK and Denmark have a similar percentage of primary school, around 22%, wherein school was increased slightly from 21% to 18%. Moving further, on world average the second-highest number of children in primary school was 27% although in the secondary academy was the fourth place of pupils proportions nearly 18%.
Overall, South Korea was the first higher proportion of pupils in primary school as well as lower secondary school, While Iceland had the least class size for both the institutes.
Follow Us on IELTSFever Twitter for more updates
Discover more from IELTS Fever
Subscribe to get the latest posts sent to your email.


