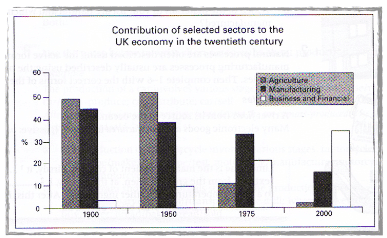
The graph below shows the contribution of three sectors- agriculture, manufacturing, and business and financial services- to the UK economy in the twentieth century. Summarize the information by selecting and reporting the main features, and make comparisons where relevant.
The bar chart provides information about how three various sectors (agriculture, manufacturing and business and financial services) contributed to the economy of the UK percentage-wise between 1900 and 2000.
Overall, the manufacturing sector experienced a downward trend, while business and financial services showed upward. The agriculture sector had some fluctuations. Although business and financial services initially had a lower rate, it outraced agriculture and manufacturing at the end of the period.
The agricultural segment contributed almost a half of the percentage in 1900 and went up slightly by around 4% in the next half-decade. However, it declined remarkably up to a one-tenth by the year 1975 and hitting a low-point merely around 2% in 2000.
In the year 1900, contribution by trade and financial services was just about 3%, and it rose marginally to approximately 10% in 1950. It further increased by 10% in next twenty-five years, when about a one-third of proportion was made up by manufacturing units. Business and financial services reversed the situation in a century and largely contributed to the UK economy at around 38% in the year 2000.
Contribution by manufacturing sector was about 45% at the beginning of the period, and it experienced gradual decline approximately up to 18% in 2000, over the period of 100 years.
Follow Us on IELTSFever Instagram for more updates and the latest test tasks.
Also, Read The Chart Below Shows the Percentage of Young People in Higher Education

