The graph gives information about the drinking habits of the US population by age. Summarise the information by selecting and reporting the main features, and make comparisons where relevant. Write at least 150 words
 Sample answer of The Graph Gives Information About the Drinking Habits of the US
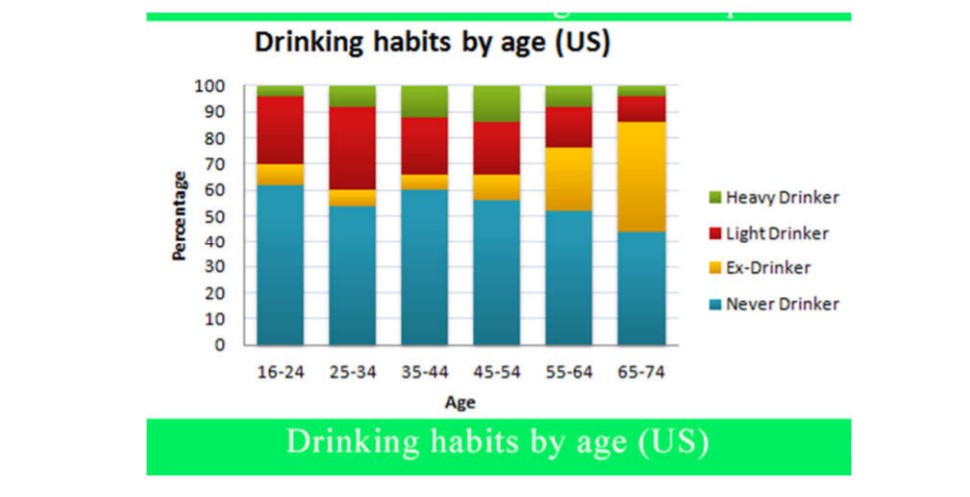
The bar chart illustrates the comparison of four types of drinking habits of persons as per their age group in the United States. The data analysis in the percentage of drinkers for US citizens.
According to the data, more than 60% of people with age group between 16 to 24 never touched the alcohol at the other hand nearly 5% person’s addicted to heavy drinking habits while less than 10% have absenteeism of drinking wine. At the same time with the young age group of 25-34 except light drinking which is more than 30% peoples have identical habits of the age group for 16-24.
It is quite interesting that peoples love to drink alcohol between the age group of 35 to 54 years & where it is downwards side in senior citizens compared to young ones. The rate of foreswear habit of alcohol rapidly increased while people getting more older and never drinking popularity falling off with increasing age.
Overall highest drinker ratio is observed in the age group of 45 to 54; Light drinkers are age group of 25 to 34 years for which concerned authorities had to take already imperative decisions which almost 40% of Americans forget to drink while they have aged to 65 and above.
Discover more from IELTS Fever
Subscribe to get the latest posts sent to your email.


