


The Line Graph Below Shows the Percentage of Female Members of Parliament in 5 European countries from 2000 to 2012. Summarize the information by selecting and reporting the main features, and make comparisons where relevant.


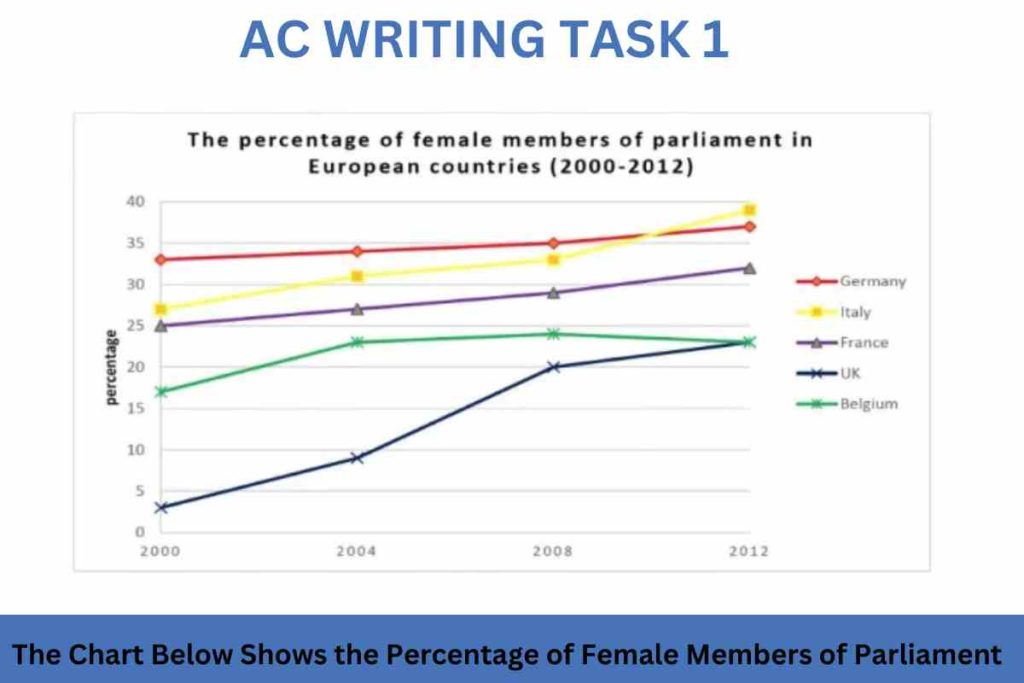
The line graph depicts the women’s member in parliaments in a twelve-year period beginning from 2000 to 2012.
The number of members parliamentary of Germany and France was always high, around 34 and 25 respectively, from the beginning, and as the years progressed, the involvement increased at a slow pace, but by the year 2012, the members were 35 and above, and 30 plus for France.
Mentioning the decline, it was observed in Belgium, where the initially the members were above 15 it rose up by additional ten members by 2004 and remained the same until 2008. But by 2012, they 0had seen a drop of 5 members, marking around 20 plus by the end.
The most significant growth was seen by the UK, from less than five members at the beginning of 2000 to more than 20 by 2012. Italy also sore at the rate of 5 members’ growth consistently every five years.
![]()

Sample 2:- The line graph Below Shows the Percentage of Female Members of Parliament
The graph chat illustrates the women. Who were Members of Parliament in five different European countries like Germany, Italy, France, the UK, and Belgium.
Overall, the UK had the least members of ladies in the assembly. Than the other four countries, which was later become equal to Belgium and Italy, become a higher percentage of women in parliament among all five nations.
To begin with, Germany was the first nation where 34% of ladies were part of parliament in 2000. But this proportion increased silently and rose to 1%, which was equal to 35% at the end of 2012. Italy and France had almost the same amount of women staff in the beginning.
However, in 2008, the number of Members of Parliament of both countries, Italy and France, increased sharply by 7% and 5%, which led Italy to the highest number of women in parliament. Additionally, in 2000, the UK had less number of women in the assembly, approximately 2%, by the time it rose rapidly and became equal to the member of Belgium.
Moreover, Belgium was increasing the Member of Parliament. But there was a minor drop at the end of 2012, which state, in the end, Belgium and the UK had a total of 23% of women as parliament.