
The pie charts below compare water usage in San Diego, California and the rest of the world. Summarise the information by selecting and reporting the main features and making comparisons where relevant.
 Sample Answer of The Pie Charts Below Compare Water Usage in San Diego, California and The Rest of The World
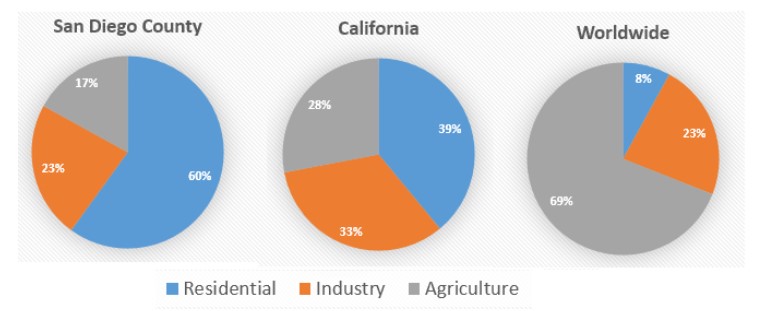
A piece of information about the usage of water for residential, industries and agriculture in two different countries and the worldwide usage was depicted by the three distinct pie charts.
Overall, although the maximum quantity of water used for agriculture in the rest of the world instead of two countries, minimum for residential purposes as compared to San Diego and California.
To begin with, 60% of the water used for residential, which was the highest proportion in San Diego, 39% used in California for the same purpose and worldwide proportion for residential was 8% which was the least quantity of water.
Furthermore, for industrial purposes, 23% of the water is used by San Diego. 33% and 23% used by California and other rest countries respectively. Moreover, 28% of the water is wasted for agriculture in California. Although only 17% of the water used in agriculture in San Diego, 69% was worldwide usage in agriculture.
Follow Us on IELTSFever Twitter for more updates
Discover more from IELTS Fever
Subscribe to get the latest posts sent to your email.


