


The pie charts show the electricity generated in Germany and France from all sources and renewables in the year 2009.
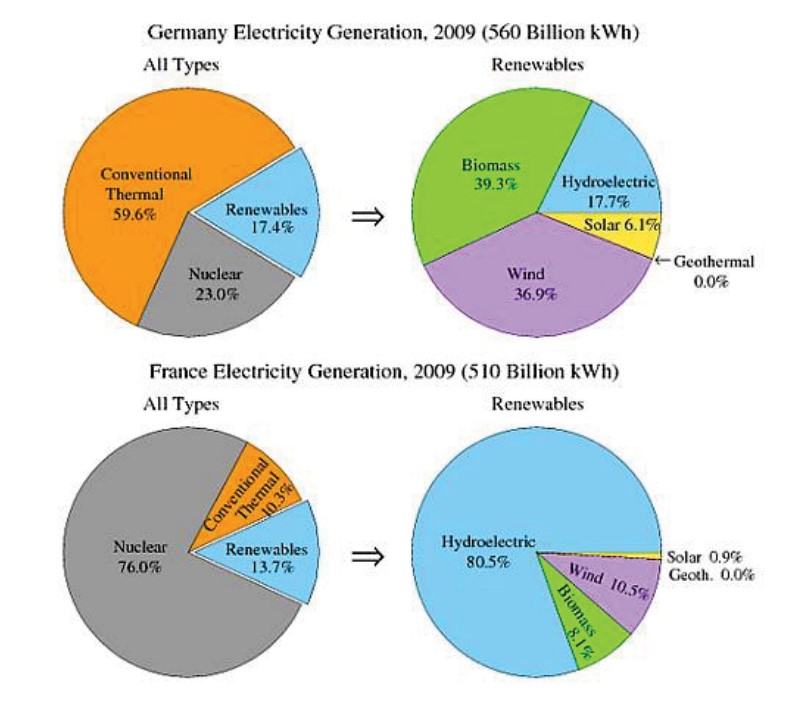

The chart illustrates electricity manufacturing with several methods in Europe countries in 2009. Overall it is immediately apparent from the chart Germany had the maximum production of electricity and France also followed the same value in electricity generation. Therefore, the source mode that produces the power supply on a large scale was all types.
In detail, a heavy load of electricity was obtained with the mode of conventional thermal with three-fifths of the load from the total at 59.6% in Germany, and 39.3% of currently produced from renewable sources which were biomass and wind built 3% less it from the biomass. It is interesting to note that hydroelectric constructed 17.7% of electricity renewable. Following this, geothermal had an insignificant contribution to electricity, but 6.1% of the current was built from solar power. Moreover, nuclear power was quite lower in Germany compared with France at 23% available gave a contribution with shares at 17.4% in 2009.
Furthermore, a higher amount of electricity was made with the source nuclear with shares at 76%, but the conventional thermal had a 10.3% current ratio in France. Therefore, 13.7% of current was manufactured from renewable which was all types. Following this, 80.5% of currently fabricated from hydroelectric power in renewables. Moreover, solar and geothermal had insignificant value in electricity but wind and biomass at 10.5% and 8.1% respectively, which offered a little electricity in France in 2009.
Follow Us on IELTSFever Twitter for more updates