
The pie graphs show the nutritional consistency of two dinners. Write a report to a university lecturer describing the data. Write at least 150 words.
Sample Answer of The Pie Graphs Show the Nutritional Consistency of Two Dinners
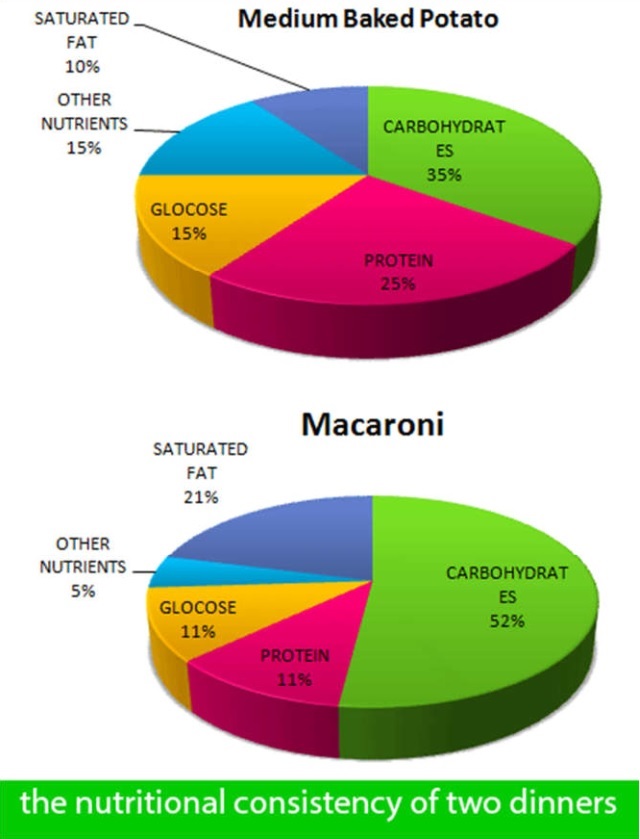
The pie chart compares the nutritional constituents ( carbohydrates, protein, Glucose, Saturated fats, other nutrients) of two different dinners ( Macaroni and Medium baked potato)
Overall, the value of carbohydrates in both dinners are high. In addition, the medium baked potato had a higher percentage of protein and glucose.
There is a substantial amount of protein and other nutrients present in a medium baked potato. A medium baked potato has a lower percentage of Saturated fats at 10 per cent compared to Macaroni with 21 per cent. The glucose content of both macaroni and medium baked potato stood at 11 per cent and 15 per cent, respectively. While other nutrients in macaroni recorded a lower percentage of 5 per cent, medium baked potato had 11 per cent.
Carbohydrates have a higher percentage in both dinners. Medium baked potato had a low carbohydrate but still took a larger part of the meal at 35 per cent while Macaroni had more than a quarter, 52 per cent. In contrast, medium baked potato has more protein than macaroni at 25 per cent and 11 per cent, respectively.
Discover more from IELTS Fever
Subscribe to get the latest posts sent to your email.


