
The Ratio of students Attending Four Secondary School Types Between
2000 and 2009.
Summarize the information by selecting and reporting the main features and make comparisons where relevant.
You should write at least 150 words.
SAMPLE ANSWER:
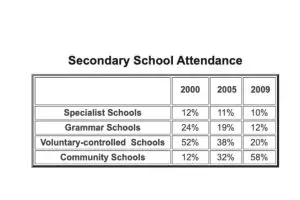
The given graph elucidates the percentage of pupils of 2000, 2005 and 2009 attending four different secondary schools.
In the year 2000, more than half of pupils attended voluntary controlled schools. Following, around a quarter of juveniles were associated with grammar schools. The bit in specialist schools the attendance of pupils listed to 12% similar to that of a community school. In 2005, the proportion attendance of grammar schools and voluntary controlled schools showed decrement and reached to 19% and 38% respectively. On the other side, community school showed increment which pointed to 32% and the specialist school made a slight decrease of 1% than that in 2000.
However, in 2009 the attendance of pupils in community schools reached 58% and that of other schools remained under 20% only with the following proportion at 10% with the specialist school. 12% with grammar school and 20% with a voluntary school.
Overall, community school showed steady increment and attentiveness along with studying, other schools followed with constant downhill reaching to a very lesser amount of proportion.
SAMPLE ANSWER 2:
The proportion of pupils attending four secondary school types between 2000 and 2009.
The tabular chart represents the information about the percentage of students, who enrolled in specialists, grammar, voluntary controlled, and community schools in three different years(2000,2005,2009).
Overall, the far maximum attendance of pupils was noticed in a community school in 2009. However, the proportion of students attending community schools increased, but in the rest of the schools, this proportion decreased in a given period of time.
It is apparent that the far higher attendance of students was observed in a community school in 2009, accounting for 58%, while only 10% of students enrolled in the same school and the same year. In 2009,12%and 20% of students attending in grammar and voluntary controlled school .voluntary schools and community schools had less than 40% pupils attendance in 2005, whilst it decreased by 21% and 29% in specialist school and grammar schools respectively.
Probing further, voluntary controlled schools was the second-highest attendance for a secondary school in 2000 with 52%.In contrast, a similar proportion of student attendance was recorded in specialist and community schools in 2000, amounting to 12% for each. 24% of secondary students attended grammar school in 2000.
This is the end of academic writing task 1: (The Ratio of students Attending Four Secondary School Types Between )
Discover more from IELTS Fever
Subscribe to get the latest posts sent to your email.


The above table illustrates the proportion of students in specialist , grammar ,voluntary controlled and community schools in the the three years. It’s clear from the figure that the attendence of students has declined in the first three schools in given three years whereas the attendence of students rose markedly in the community schools .
In the year 2000, there was only 1% decrease in the number of students which is kept reduced by 1% till the final year 2009 .In the grammar and voluntary – controlled schools , the attendence of students fallen down from the year 2000 to 2009 . The attendence in grammar schools decreased from 24 % to 19% and finally it came to 12% in the final year 2009 .The voluntary controlled schools lose almost 14 % to 17% attendence till 2009 .
It can be admitted that most of the pupils chosen to go to community schools that these schools are on the first place having 58% of attendence in final year which is quite higher than the above three other schools .
The Proportions of Pupils Attending Four Secondary School Types Between 2000 and 2009.
The given tabular chart depicts the information about the ratio of secondary school attendance by the students from 2000 to 2009
it can be clearly seen that number of learners in a specialist schools in 2000, 2005 and 2009 were 12% , 11% and 10% respectively. while, in 2000 count of learners was 5% more than 2005 that was 24 % as well as amount of scholars reduced by half in 2009 that was noted as 12%
Moving further, it is evident from the chart that in voluntary control School percentage of learner was recorded as 52% in 2000 whereas, after half decade it sharply dropped to 38% and after 4 year it decrease by 18%. furthermore, in 2005 the proportion of pupils who studied in communicating school was almost thrice of the student who studied in 2008 that was 32% and in 2009 it reached to 58%.
overall, it can be concluded that maximum attendance of student was in voluntary community schools.
The given table illustrates the information about percentage of student attending specialist schools, grammar schools, voluntary controlled schools, community schools in year 2000 to 2009. overall, the percentage of students attending all the schools was decreased in both of years,
but only community schools percentage was increased in this time period. In turns of specialist schools in 2000,12% students attended, it which decreased by 1% .
In 2005 and 2009 both years the respective value were 11% and 10% . Moreover, the grammar schools covered maximum students attendance in 2000(24%).Than other two year it is decreased at 19% and 12%. In 2009 the attendance of students was half than year 2000.
Moreover, in voluntary controlled schools student attendance was decreased day by day notice that the value were 52%,38% and 20% respect ion