Sample Answer:- The Table Chart Illustrates Data on Underground Railway Systems in Six Major Cities
The tabular chart illustrates the details of underground railways in 6 cities according to their age, length and number of passengers.
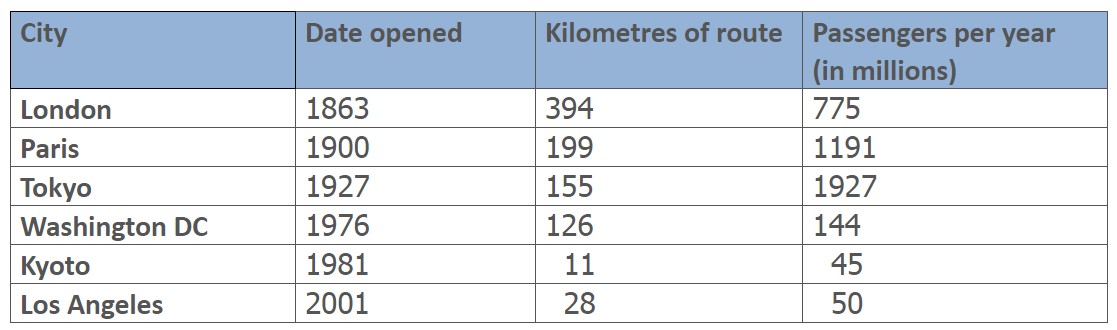
Overall, it can be clearly seen that the oldest and longest railway system is in London, while the highest number of passengers travel in Kyoto.
To begin with, the railways in London and Paris were opened in the 19th century. Whereas Tokyo, Washington DC and Kyoto had railways opened in the 20th” Century. The most recent railways were opened in Los Angeles in 21″ Century. London, On the other hand, London has 394 km of route. Which is more than double the route of Tokyo and Washington DC. Kyoto and Los Angeles, In contrast, have the shortest routes with 11km and 28 km, respectively.
In regards to number of passengers served, Tokyo has 1927 million passengers, making it the busiest subway. The second and third busiest railways are in Paris and London. Least passengers travel in Kyoto and Los Angeles with 45 million and 50 million passengers.
Discover more from IELTS Fever
Subscribe to get the latest posts sent to your email.