
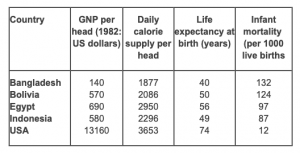
The table gives statistics showing the aspects of quality of life in five countries.
Summarize the information by selecting and reporting the main features and make comparisons where relevant.
You should write at least 150 words.
sample answer :
The table illustrates the information regarding the statistics of five countries in order to demonstrate the quality of life.
Overall, the USA has the highest quality of life as compared to other Nation in terms of GNP per head, daily calorie supply, and yearly life expectancy, Whereas Bangladesh has the lowest quality of a life. Moreover, in the USA infant mortality rate is lower due to high-quality Lifestyle, while in Bangladesh motility rate of in infant is highest.
In Bangladesh, the quality of life is lower as compared to other countries. Bangladesh had 140 US dollars GNP per head and 1877 daily calorie supply per head In 1982. the birth year is 40 years in Bangladesh and the rate of infant mortality is higher, with 132 infant mortality per 1000 live births. On the opposite side, the USA had the highest GNP rate(13160 US dollars) per head and daily calorie supply (3653) per head. The life expectancy is also higher, which is around 74 years. The infant mortality rate is lower in the USA. Bolivia and Indonesia had an equal GNP rate, daily calorie supply rate, and life expectancy rate. But, in terms of infant mortality Bolivia (124 )had a high mortality rate as compared to Indonesia(87). After the USA, Egypt is the second topmost country in the aspects of a quality lifestyle.
This is the end of ACADEMIC writing task 1(The table gives statistics showing the aspects of quality of life in five countries. Summarize the information by selecting and reporting the main features and make comparisons where relevant.)
Discover more from IELTS Fever
Subscribe to get the latest posts sent to your email.


Very good ! And helpful