Details the Process of Making Clothes From Plastic Bottles
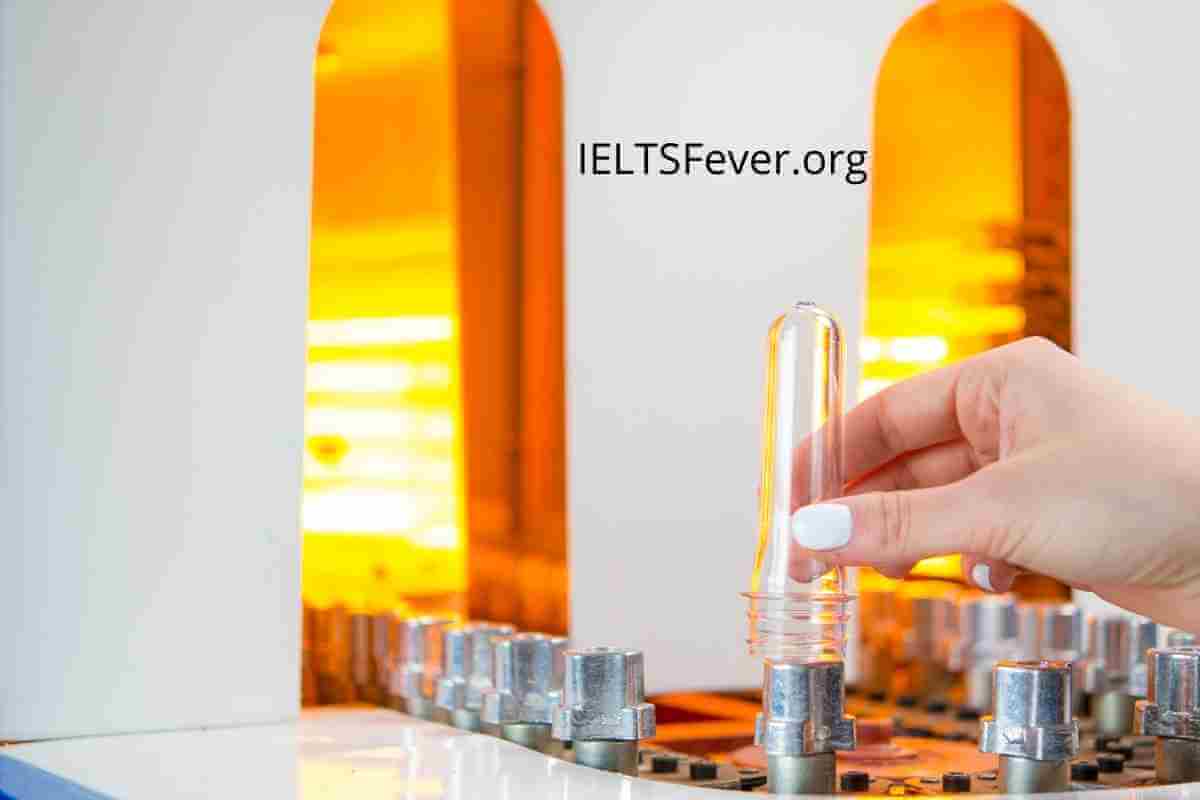
The diagram details the process of making clothes from plastic bottles. Summarise the information by selecting and reporting the main features and make comparisons where relevant.…
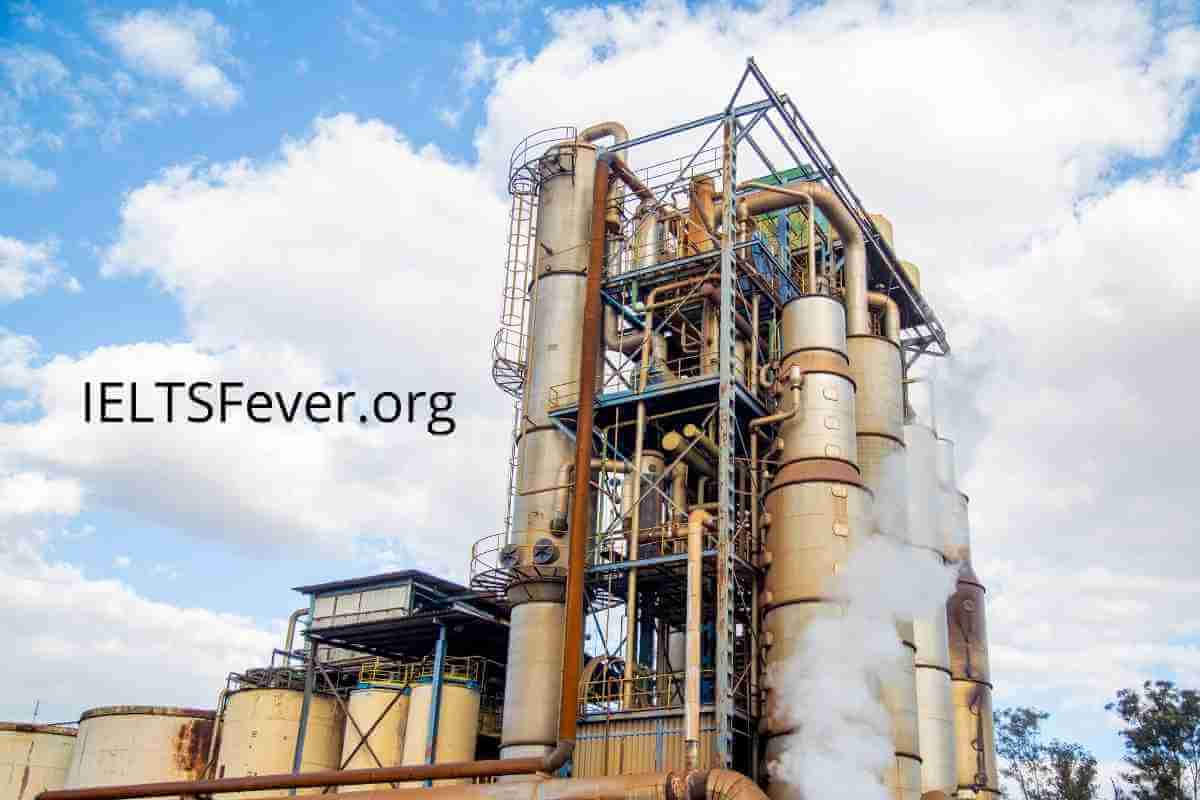
The illustrations show how chocolate is produced. Summarize the information by selecting and reporting the main features and make comparisons where relevant. Write at least 150…
The diagram below shows the manufacturing process for making sugar from sugar cane. Summarise the information by selecting and reporting the main features, and make comparisons…
The bar chart shows the number of visitors to four London museums. Summarize the information by selecting and reporting the main features and make comparisons where…
The diagram below shows the process for recycling plastic bottles. Summarise the information by selecting and reporting the main features, and make comparisons where relevant. Sample…
The diagrams below show a structure that is used to generate electricity from wave power. Summarise the information by selecting and reporting the main features, and…
The plans below show the site of an airport now and how it will look after redevelopment next year. Summarise the information by selecting and reporting…
Crimes and Other kinds of information on Tv and Newspapers have bad consequences. This kind of information should be restricted to be shown in the media.…
The plans below show a theatre in 2010 and 2012. Summarise the information by selecting and reporting the main features and making comparisons where relevant Sample…
The plans below show the mining townsite in the past and after redevelopment in the present day. Summarise the information by selecting and reporting the main…
The pie chart below shows energy is used in a typical Australian household, and the table shows the amount of electricity used according to the number…
The pie chart gives information about the country of birth of people living in Australia, and the table shows where people born in these countries live.…