The Bar Chart Illustrates the Percentage of Businesses in Spain
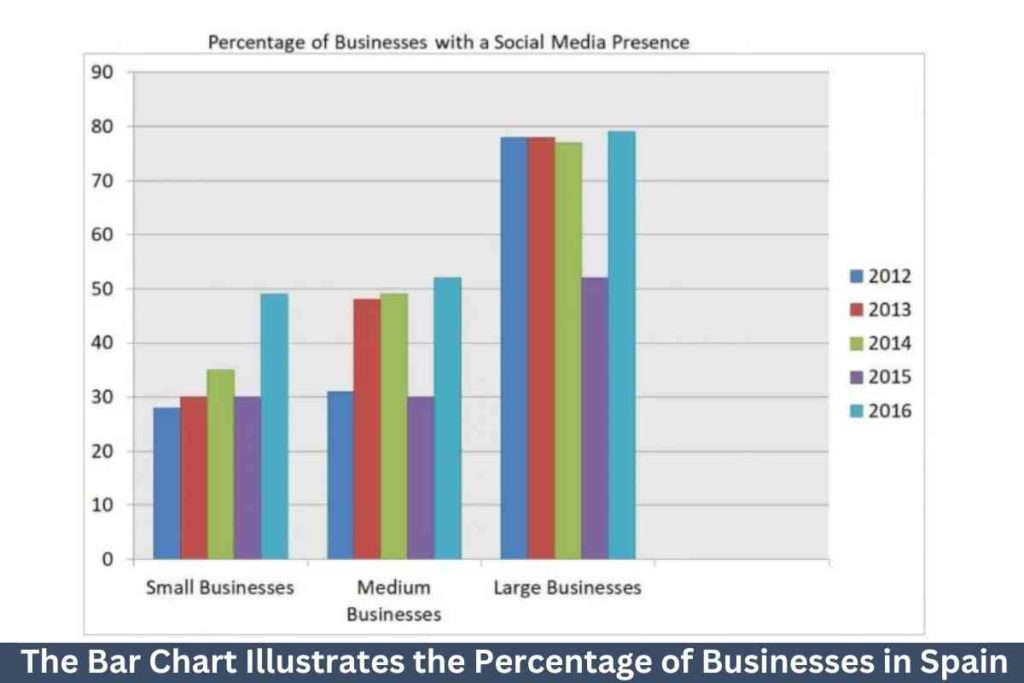
The bar chart illustrates the percentage of businesses in Spain that had a social media presence from 2012 to 2016. Summarise the information by selecting and reporting the main features and make comparisons where relevant. Sample 1:-The Bar Chart Illustrates the Percentage of Businesses in Spain The bar chart shows data on the percentages of […]
The Bar Chart Illustrates the Percentage of Businesses in Spain Read More »