The table below shows the percentage participation of women in senior management in three companies between 1975 and 2015. Summarise the information by selecting and reporting the main features and make comparisons where relevant.
 Sample 1:-The Table Below Shows the Percentage Participation of Women in Senior
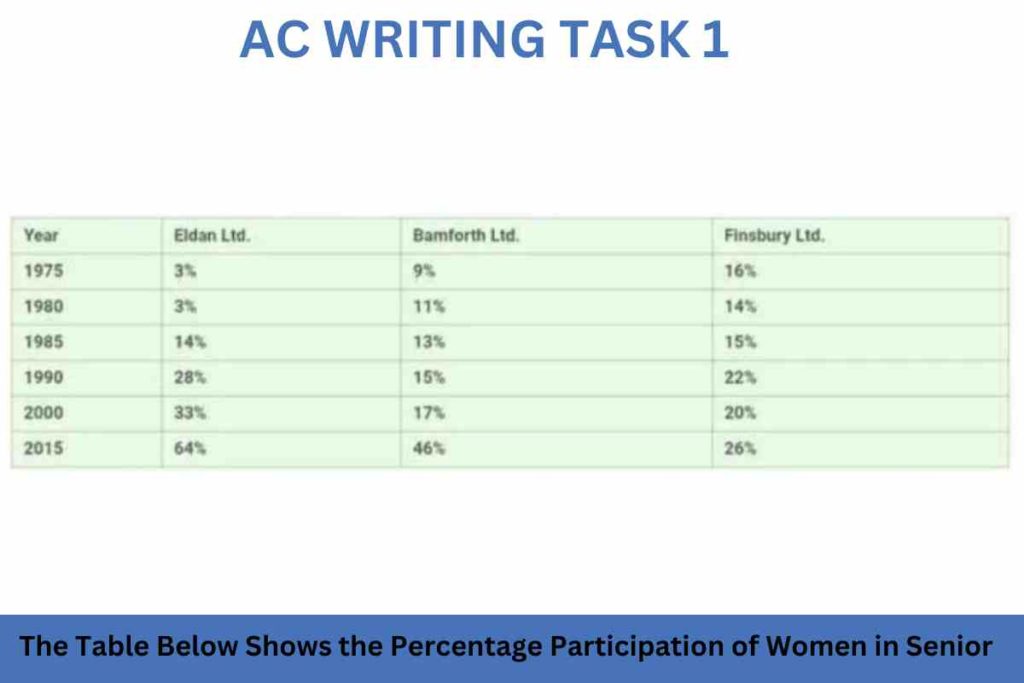
The table illustrates the proportion of women that participated in senior management courses in three industries ( Eldan et al.) from 1975 to 2015, presented in percentage.
Overall, it is noticeable that the number of females who took part in the program increased over the given timeframe. Also, Eldan Limited had the highest number of females participating at the end of the period.
To begin with, there were only 3% of attendees from Eldan Limited in the year 1975, whereas 9% of ladies were from Banforth Limited, and Finsbury had the highest amount of women attending the seminar this year. Although, in 1980, ladies that attended the seminar from Eldan stayed the same as the previous year, Banforth witnessed an increase while Finsbury experienced a decline till 1985.
Furthermore, the number of ladies participants from Eldan and Banforth increased from 1985 to 2015 and finished at 64% and 45%, respectively; however, Finsbury witnessed a fluctuation in 2000, where it dropped to just 20%. In 2015, 26% of women attended the program, and it was the company with the least participant compared to the other two.
![]()
Sample 2:-The Table Below Shows the Percentage Participation of Women in Senior
The table depicts information about the proportion of ladies taking part in management duties in three companies between 1975 and 2015.
Overall, it can be said that women’s involvement in management duties increased in Eldan Ltd. and Bamforth Ltd. while it fluctuated for Finsbury Ltd. over the given time period.
Two commence with, after analyzing the table, it can be clearly seen that the women’s participation in management was 3% in 1975 in Eldan, which remained stable by 1980. After that, it significantly increased to 14% by 1985 while this data became two times in 1990 and then it grew sharply to 64% over the given time period.
Similarly, for Bamforth, this data was nearly three times as compared to Eldan in the initial years, then it became around twice(17%) and fivefold(46%) in 2000 and 2015, respectively.
However, this data fluctuated over the given time period for Finsbury Ltd. The women’s contribution fell slightly from 16% to 14% by 1980 but then rose considerably to 22% in the next decade. After that, it again decreased to 22% in the next decade but then reached 26% by 2015.
Discover more from IELTS Fever
Subscribe to get the latest posts sent to your email.


