The graph below shows the number of hours per day on average that children spent watching television between 1950 and 2010. Summarise the information by selecting and reporting the main features, and make comparisons where relevant.

Sample Answer:-The Graph Below Shows the Number of Hours per Day on Average
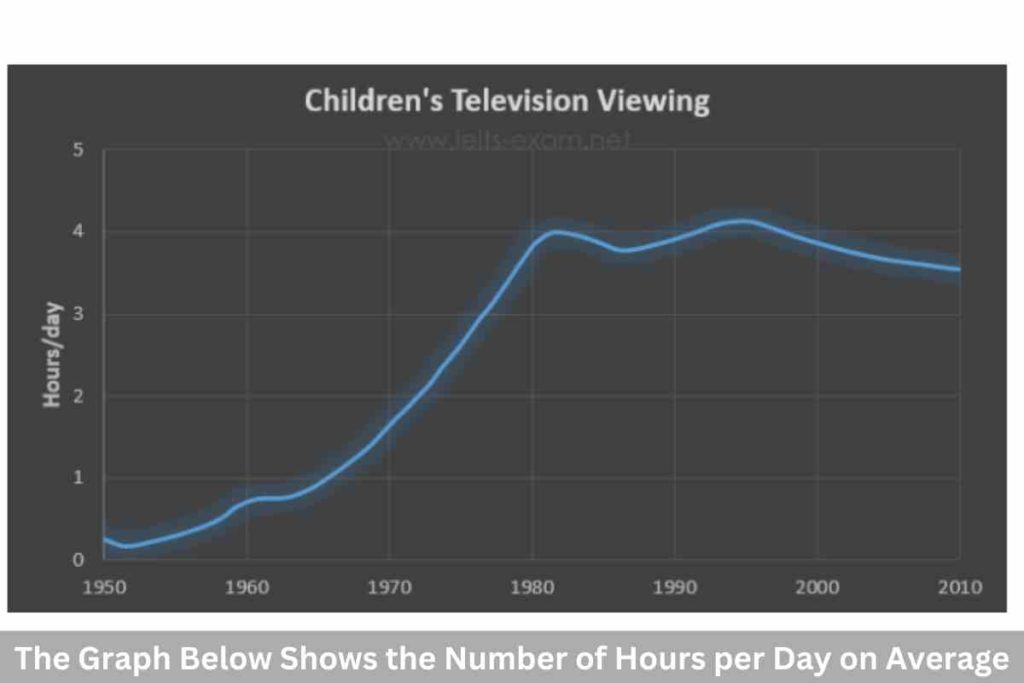
The provided line graph presents the cumulative duration of television viewing by children within a 24-hour period, spanning from 1959 to 2010.
Overall, it is evident that there was a progressive surge in the proportion of children engaged in watching TV programs . Highest was between year 1990 and 2000.
Commencing with the initial phase, between 1950 and 1960, there was a gradual upward trend observed in the average hours dedicated by children to television. In year 1970 it was at almost 1.5 hours in a day. From year 1970 to 1980 graph got massive increase and reaches to 4 hour per day.
During the subsequent period, spanning from 1985 to 1995. There were fluctuations observed in the duration of time children spent watching television. Furthermore, over the subsequent decade, there was a noticeable decline in the number of hours devoted to television viewing by children, reaching a value of 3.5 hours per day.
![]()
Discover more from IELTS Fever
Subscribe to get the latest posts sent to your email.


