Free Computer-Based IELTS Mock Tests - Start Free CBT Test at cbt.ieltsfever.org

The Bar Chart Below Shows the Total Number of Minutes
The bar chart below shows the total number of minutes (in billions) of telephone calls in Australia, divided into three categories, from 2001- 2008. Summarise the information by selecting and reporting the main features and make comparisons where relevant. Write at least 150 words Sample Answer of The Bar Chart Below Shows the Total Number

The Bar Chart Below Shows the Total Number of Minutes Read More »

The Diagram Shows the Relationship Between Many Different Languages

The Diagram Shows the Relationship Between Many Different Languages

The diagram shows the relationship between many different languages. Summarise the information by selecting and reporting the main features, and make comparisons where relevant. Write at least 150 words. Sample Answer of The Diagram Shows the Relationship Between Many Different Languages The provided diagram demonstrates the relationship of the different language on a different continent.

The Diagram Shows the Relationship Between Many Different Languages Read More »

The Pie Graphs Show the Nutritional Consistency of Two Dinners

The Pie Graphs Show the Nutritional Consistency of Two Dinners

The pie graphs show the nutritional consistency of two dinners. Write a report to a university lecturer describing the data. Write at least 150 words. Sample Answer of The Pie Graphs Show the Nutritional Consistency of Two Dinners The pie chart compares the nutritional constituents ( carbohydrates, protein, Glucose, Saturated fats, other nutrients) of two different

The Pie Graphs Show the Nutritional Consistency of Two Dinners Read More »

Automatic Photo Booth Academic Writing

Automatic Photo Booth Academic Writing

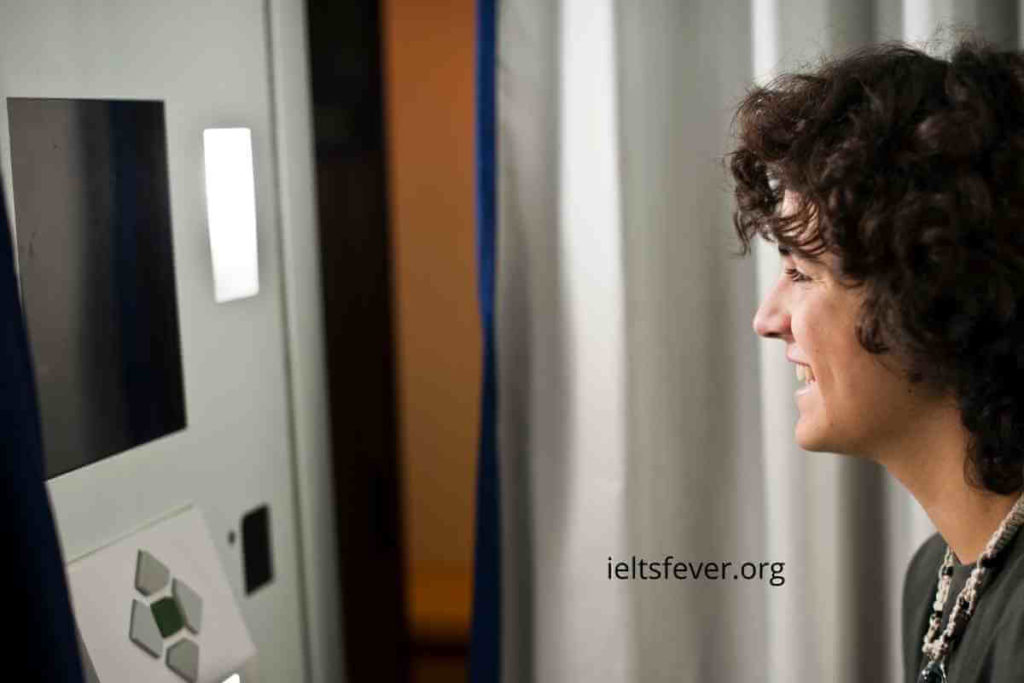
Automatic Photo Booth Academic Writing Summarise the information by selecting and reporting the main features and make comparisons where relevant. Write at least 150 words. Sample Answer of Automatic Photo Booth Academic Writing The provided diagram demonstrates the automatic photo booth wisdom as well as its features and steps for taking a photo. Overall, there are

Automatic Photo Booth Academic Writing Read More »

Describe a Place/person/home You Like to Visit but Don’t Want to Live There.

Describe a Place/person/home You Like to Visit but Don’t Want to Live There.

Describe a Place/person/home You Like to Visit but Don’t Want to Live There. You should say What place is it? When do you visit that place? How do you feel about it? Why don’t you want to live there? I am an adventure lover and I love to explore places, yet I have visited a

Describe a Place/person/home You Like to Visit but Don’t Want to Live There. Read More »

The Graphs Indicate the Source of Complaints About the Bank of America

The Graphs Indicate the Source of Complaints About the Bank of America

The graphs indicate the source of complaints about the bank of America and the amount of time it takes to have the complaints resolved. Summarise the information by selecting and report in the main features, and make comparisons where relevant. Write at least 150 words. Sample Answer of The Graphs Indicate the Source of Complaints About

The Graphs Indicate the Source of Complaints About the Bank of America Read More »

Describe the Information in the Table and Make Comparisons Where Appropriate

Describe the Information in the Table and Make Comparisons Where Appropriate

Describe the information in the table and make comparisons where appropriate. Write at least 150 words. Sample Answer of Describe the Information in the Table and Make Comparisons Where Appropriate The provided table demonstrates the per person average travelled distance which measures in miles, 8 different travel modes compared it to 2001 and 2006. Overall,

Describe the Information in the Table and Make Comparisons Where Appropriate Read More »

IELTSFever FREE Online Test Day 100 Recent Exam

IELTSFever FREE Online Test Day 100 Recent Exam

IELTSFever FREE Online Test Day 100 Recent Exam Tests Must Read These Instructions before participating in Exam. The answer to every question is mandatory; otherwise, we will not accept it. Send your answers to [email protected] with your name, city along with the question Test Number like IELTSFever FREE Online Test Day 100 ( in the subject field of

IELTSFever FREE Online Test Day 100 Recent Exam Read More »

The Graphs Show Figures Relating to Hours Worked and Stress Levels Amongst Professionals in Eight Groups

The graphs show figures relating to hours worked and stress levels amongst professionals in eight groups. Describe the information shown to a university or college lecturer. Write at least 150 words. Sample Answer of Figures Relating to Hours Worked and Stress Levels Amongst Professionals in Eight Groups The illustration delineates the average working hours of

The Graphs Show Figures Relating to Hours Worked and Stress Levels Amongst Professionals in Eight Groups Read More »

The Bar Graph Indicates Sales Figures for Reading Materials From 2002 to 2012

The Bar Graph Indicates Sales Figures for Reading Materials From 2002 to 2012

The bar graph indicates sales figures for reading materials from 2002 to 2012. Write a report to a university lecturer describing the information shown below. Write at least 150 words Sample Answer of The Bar Graph Indicates Sales Figures for Reading Materials From 2002 to 2012 The graph illustrates the expenditure on different reading materials

The Bar Graph Indicates Sales Figures for Reading Materials From 2002 to 2012 Read More »

More and More People Today Are Using Computers and Electronic Devices to Access Information

More and More People Today Are Using Computers and Electronic Devices to Access Information

More and more people today are using computers and electronic devices to access information. Therefore there is no longer any need to print books, magazines or newspaper. To what extent do you agree or disagree? Digital media has surely taken over the print media these days. Reaching millions of people with a single click of

More and More People Today Are Using Computers and Electronic Devices to Access Information Read More »

Scroll to Top