
The chart below shows estimated world literacy rates by region and by gender for the year 2000. Write a report for a university lecturer describing the information below.
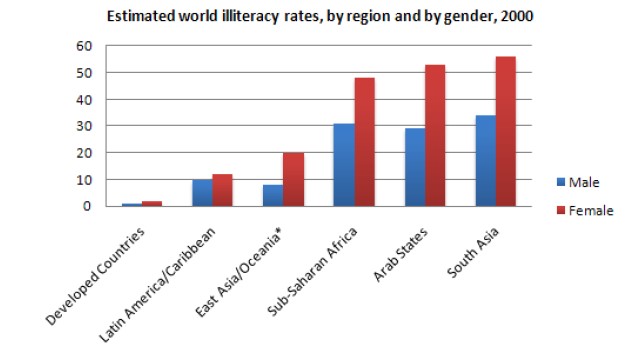
The bar graph illustrates the information about the literacy rate among different regions in the world in 2000 between males and females.
In general, the graph shows that developed countries are the least literacy rate, but South Asia has the maximum rate. However, overall, males are more educated than females in different regions of the world.
In developed countries, the illiteracy rate is so minimal as about 1% and 2% in males and females respectively, but, in South Asia, the rate is maximum near about 34% and 55% respectively in males and females. In Latin America, the difference between illiteracy is about 2%, whereas males have 10% and females have 12% illiteracy. East Asia and Sub-saharan Africa have a ratio of 12% and 18%, respectively.
Whereas in the Arab States, the gap difference between educated persons among males and females is larger, about 22% males having less than 30% and females rate is about 52% because they have more education trend toward males than females.
Follow Us on IELTSFever Twitter for more updates
Discover more from IELTS Fever
Subscribe to get the latest posts sent to your email.


