
The chart below shows the changes that took place in three different areas of crime in New Port City Center from 2003 to 2012. Summarize the information by selecting and reporting the main features and making comparisons where relevant.
 Sample Answer of The Chart Below Shows the Changes That Took Place in Three Different Areas of Crime
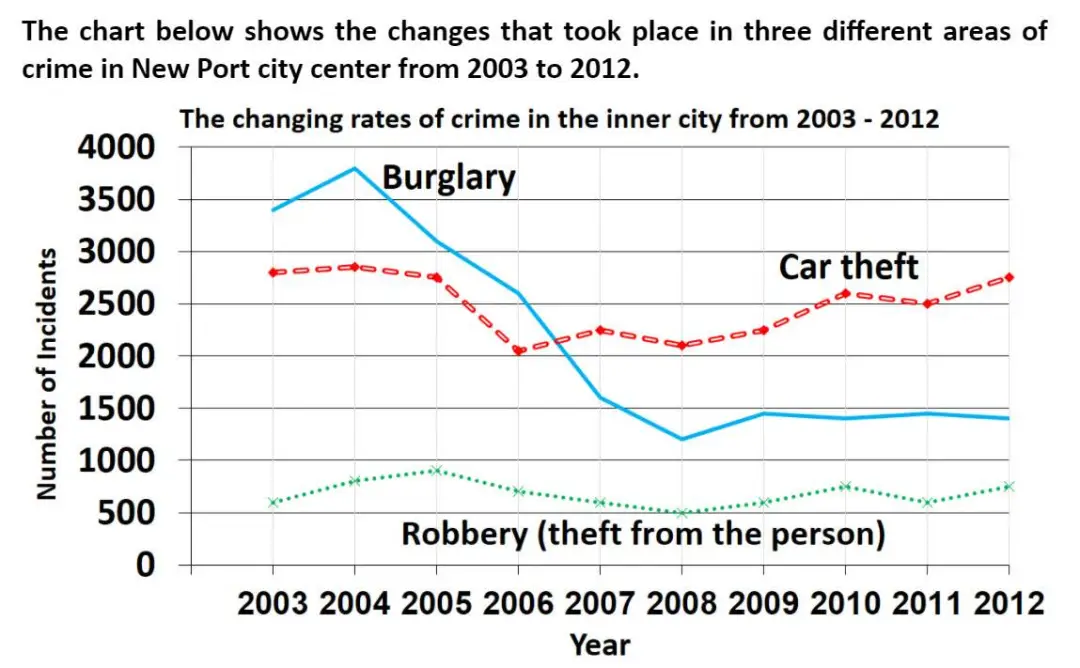
The line graph illustrates the information regarding the rate of the change in Burglary, car theft, Robbery in the new port city during the year 2003 to 2012. The data has been calibrated in numbers.
Looking at the overall perspective, it is readily apparent that the car theft crime rate was shared by an upward trend in the given period whereas the least context was shown by Burglary.
Apparently, it is crystal noticeable that in the initial year, the Burglary rate was reached at the zenith point. Then it fell sharply from 2004 to 2012. Apart from it, the crime rate of car theft was rose in the last year. After that, the four years of Robbery offence rate almost remained the same, which were approximately 500. In contrast, the car theft rate was higher than the Robbery.
Turning towards the remaining data, the rate of Robbery was constant for some years. The 2004to 2008, the crime rate of Burglary were sharply down. Furthermore, it was reached 2200 in 2012 rather than Robbery.
Follow Us on IELTSFever Twitter for more updates
Discover more from IELTS Fever
Subscribe to get the latest posts sent to your email.


