The graph shows a comparison in the pulse rate changes between two different individuals of different ages and professions. Write a report for a university tutor describing the information shown in the diagrams below.
Sample 1
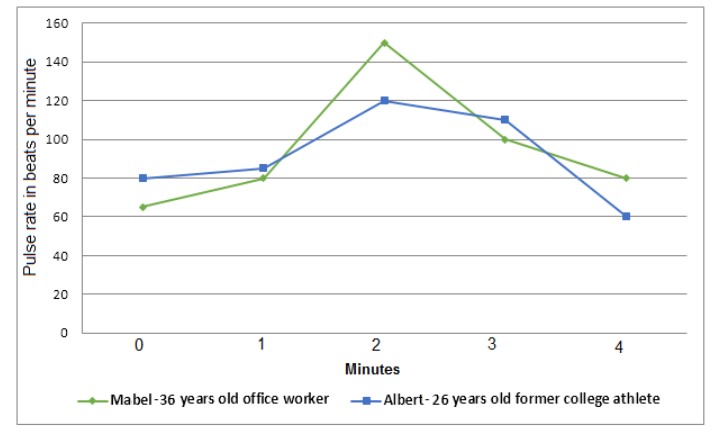
An information about the comparison in the pulse rate in beats per minute between Model-36 years old office worker and Albert- 26 years old college athlete was depicted by the line graph.
Overall, the highest pulse rate was shown by Model- 36 years old worker at 2 minutes, while least rate as illustrated by Albert- 26 years old former college athlete at 4 minutes.
Initiating with the Model- 36 years old who was an office worker, about 62 beats of pulse rate was shown at 0 minutes and this rate reached at 80 beats in next one minute. Pulse rate hit the crest at about 145 beats at 2 minutes, and after declining, this rate becomes 100 beats at 3 minutes. During 3 and 4 minutes, again dwindled was shown in the pulse rate and finally, 80 beats found at 4 minutes.
Furthermore, initially, 80 beats were shown by Albert- 26 years old, who was a former college athlete at 0 minutes and then that rate was reached at about 81 beats in the next one minute. After one minute, that rate jumped at 120 beats at 2 minutes. After some drop, pulse rate varied between 120 and 100 beats at 3 minutes and then taken a nosedive to reach 60 beats in the fourth minute.
Sample 2
The line graph reveals information about the pulse rate variability based on age and professions of two individuals, that is a 36 years old office worker and a 26-year-old former college athlete.
Overall, the office worker’s heartbeat shows a wide range of fluctuation over 4 minutes. At the same time, a former college athlete saw relatively less variability of the pulse.
Looking at details, the baseline rate of the young man was 80 and did not show a significant change in the first minute. However, starting from 1 minute had been considerably risen to reach the peak beat of 120 at 2 minutes. Then it started to go down slowly and became just above 100 in 3 minutes. Finally, substantially fell to 60 beats/minute at minute 4, which was less than the baseline.
On the other hand, the old office worker’s pulse rate began slightly above 60, which was less than the baseline of the young man, then lifted slightly and became 80 at the first minute. Next was a substantial increment to just less than two-fold. Following this, the rate plummeted to 100 over a period of 1 minute. At last, it has shown a gradual fall to 80beat at the 4th minute, which is higher than the pulse at the beginning.
To sum up, the young man’s baseline heart rate was higher than the old man, and the former one saw minimal fluctuation of the pulse over the time period. By contrast, the old man had a relatively lower baseline beat, but there was marked variability in his pulse each minute.
Follow Us on IELTSFever Twitter for more updates
Discover more from IELTS Fever
Subscribe to get the latest posts sent to your email.