
The graph below shows the pollution levels in London between 1600 and 2000. Summarise the information by selecting and reporting the main features, and make comparisons where relevant.
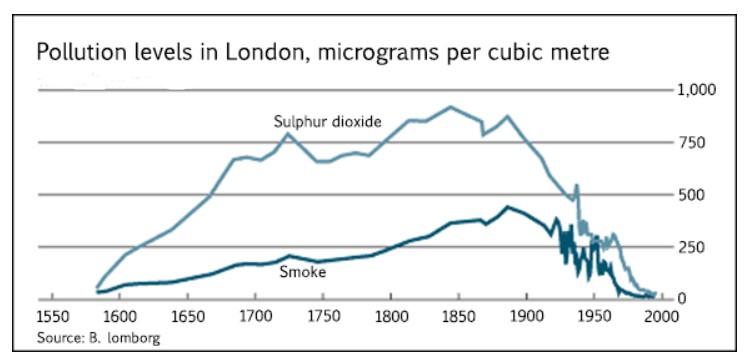
The yielded line charts illustrate the level of pollution, sulphur dioxide and smoke in London from 1600 to 2000, and it measured micrograms per cubic metre.
Overall, it can be seen that sulphur dioxide pollution was higher than smoke. Additionally, after four centuries level was the same as it was in starting phase; in the early 17th-century, pollution rose.
In the late 16th century, sulphur dioxide had 1 microgram, which grew dramatically after 1600 and had 750 micrograms in 1800. After a century level was the same although, it touched its zenith 900 micrograms. 1900 it declines steadily, had 0 pollution level in 2000.
For smoke, in 1600 had same micrograms impurity environment level as sulphur dioxide, however, later it climbed steadily and took four centuries to touched its peaks level it was 400 micrograms in 1880. After it turned to a downward trend and after slight fluctuation in 2000 level was similar as was in 1600.
Follow Us on IELTSFever Instagram for more updates and the latest test tasks.
Also, Read The Pie Chart Gives Information About the Country of Birth of People
Discover more from IELTS Fever
Subscribe to get the latest posts sent to your email.


