
The table beneath shows the level of people specialists in various kinds of enterprises in 1990, 2000, and 2010. Sum up the data by choosing and writing about the primary capacities and make correlations where fitting.
Sample Answer The Table Beneath Shows the Level of People Specialists in Various Kinds of Enterprises
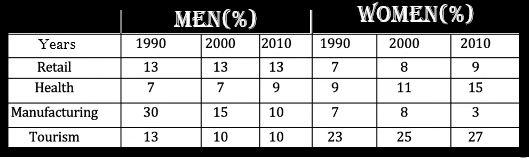
The yielded table demonstrates four different types of enterprise, namely retail, health, manufacturing and tourism specialist percentage of men and women in 1990, 2000 and 2010.
Overall, overall, it can be clearly seen that retail and health percentage rose year by year for both groups whereas manufacturing shrinks down.
For men, through the period specialist people percentage in the retail field was same on account of 13 whereas, in 1990 and 2000 health had 7 which rose 2 % in 2010. Three in ten proportion of men specialist in manufacturing, it declined a half after a decade. In 2010 it was only 10%. In the starting years, tourism specialist percentage was the same as retail had although, later, one in tenth in two decades.
For women, 7 per cent of the female specialist in retail in 1990 climbed 1% decades wise. Health had 9% which grew continually with 3% constant increasing after decades. Furthermore, in 1990 and 2000 the proportion of manufacturing was same as had in retail, however, in 2010 only 3%. For tourism, the specialist percentage was increased 23 to 27 between three decades.
Follow Us on IELTSFever Instagram for more updates and the latest test tasks.
Also, Read The Pie Chart Below Shows Energy Is Used in a Typical Australian
Discover more from IELTS Fever
Subscribe to get the latest posts sent to your email.


