The Chart Below Shows What Anthropology Graduates from One University

The Chart Below Shows What Anthropology Graduates from One University

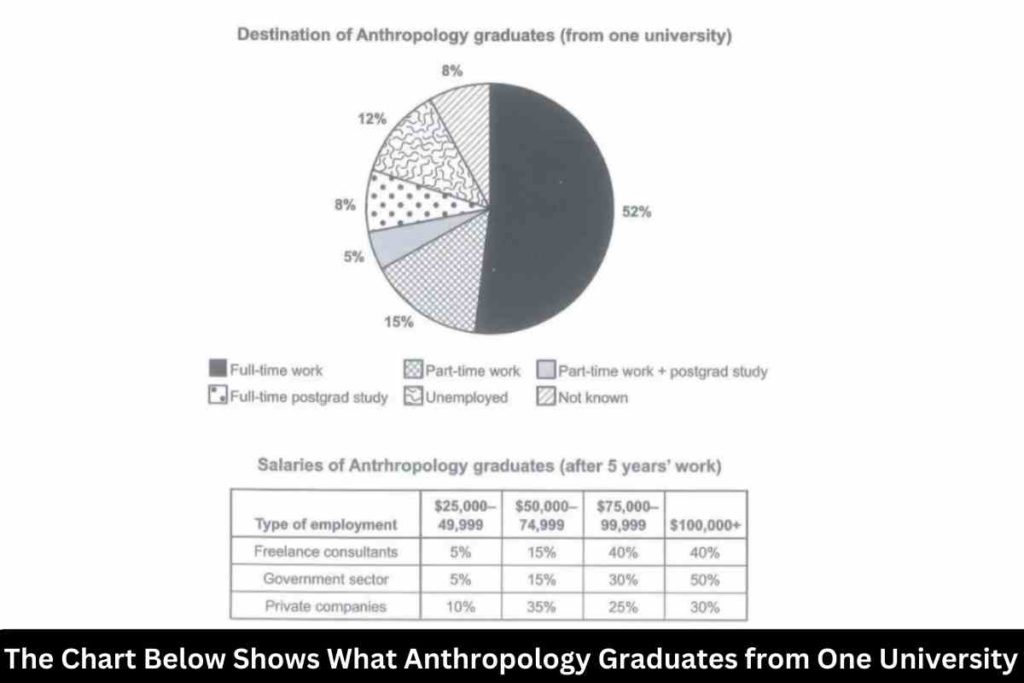
The chart below shows what Anthropology graduates from one university did after finishing their undergraduate degree course. The table shows the salaries of the anthropologist’s work after five years. Summarise the information by selecting and reporting the main features, and make comparisons where relevant. Sample 1:-The Chart Below Shows What Anthropology Graduates from One University […]

The Chart Below Shows What Anthropology Graduates from One University Read More »

IELTSFever FREE Online Mock Test Day 631 Recent IELTS Exam Tests

IELTSFever FREE Online Mock Test Day 631 Recent IELTS Exam Tests

IELTSFever FREE Online Mock Test Day 631 Recent Exam Tests Must Read These Instructions before participating in Exam. The answer to every question is mandatory; otherwise, we will not accept it. Send your answers to [email protected] with your name and city along with the question Test Number, like IELTSFever FREE Online Mock Test Day 631

IELTSFever FREE Online Mock Test Day 631 Recent IELTS Exam Tests Read More »

Some People Believe that The Increasing Use of Computers and Mobile Phones

Some People Believe that The Increasing Use of Computers and Mobile Phones

Some people believe that the increasing use of computers and mobile phones for communication is having a negative impact on the reading and writing skills of young people. Do you agree or disagree? Sample 1:-Some People Believe that The Increasing Use of Computers and Mobile Phones Mobile phones and computers are among the most important

Some People Believe that The Increasing Use of Computers and Mobile Phones Read More »

Some people think they have the right to use as much freshwater

Some people think they have the right to use as much freshwater

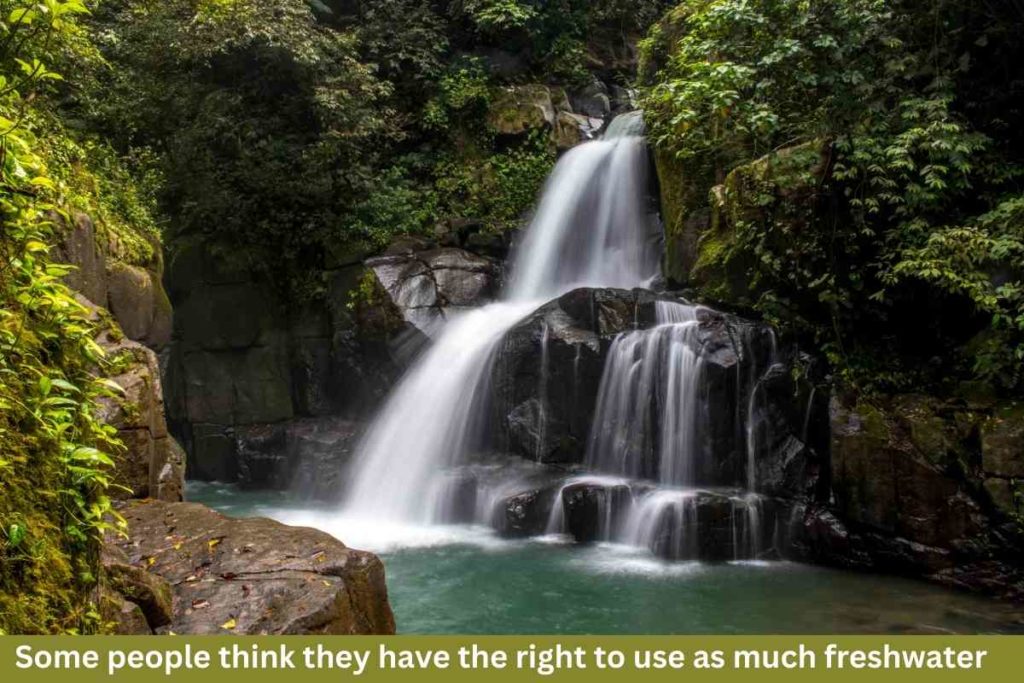
Some people think they have the right to use as much freshwater as they want, but others think that the government should control the use of freshwater as it is a limited resource. Discuss both points of view and express your opinion. Sample 1:-Some people think they have the right to use as much freshwater

Some people think they have the right to use as much freshwater Read More »

Some People Think that It Is Important to Use Taxpayer Money

Some People Think that It Is Important to Use Taxpayer Money

Some think using taxpayer money to search for life on other planets is crucial. However, others believe this is a waste of public funds because many more critical issues require funding in our world. Discuss both points of view and give your opinion. Sample 1:-Some People Think that It Is Important to Use Taxpayer Money

Some People Think that It Is Important to Use Taxpayer Money Read More »

The Map Below Is of The Town of Garlsdon: Recent AC Task 1

The Map Below Is of The Town of Garlsdon

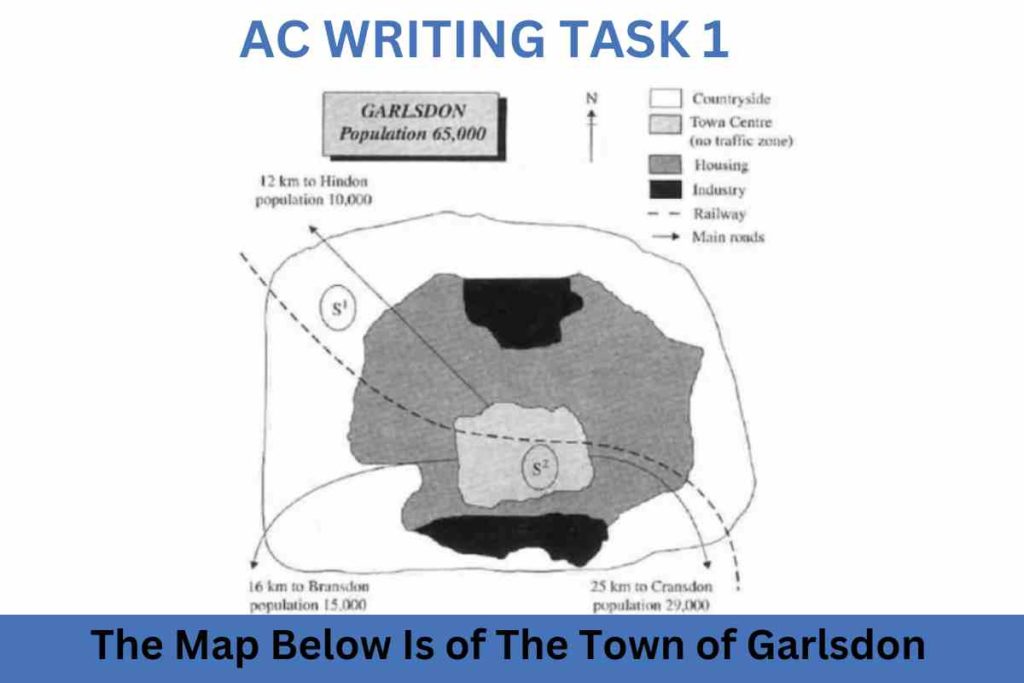
The map below is of the town of Garlsdon. A new supermarket (S) is planned for the town. The map shows two possible sites for the supermarket. Summarise the information by selecting and reporting the main features and make comparisons where relevant. Sample 1:-The Map Below Is of The Town of Garlsdon The given map

The Map Below Is of The Town of Garlsdon: Recent AC Task 1 Read More »

The Chart Below Shows Waste Collection by A Recycling Center from 2011 to 2015: AC Writing

The Chart Below Shows Waste Collection by A Recycling Center from 2011 to 2015

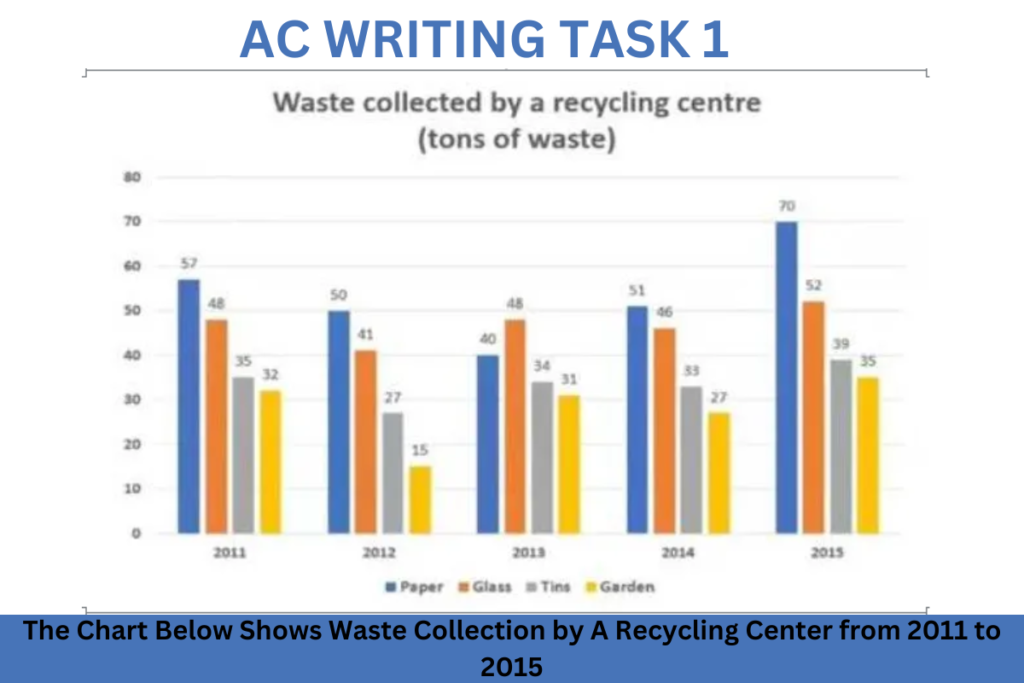
The chart below shows waste collection by a recycling center from 2011 to 2015. Summarise the information by selecting and reporting the main features and make comparisons where relevant. Sample 1:-The Chart Below Shows Waste Collection by A Recycling Center from 2011 to 2015 The Chart illustrates information about the waste collection of paper, glass,

The Chart Below Shows Waste Collection by A Recycling Center from 2011 to 2015: AC Writing Read More »

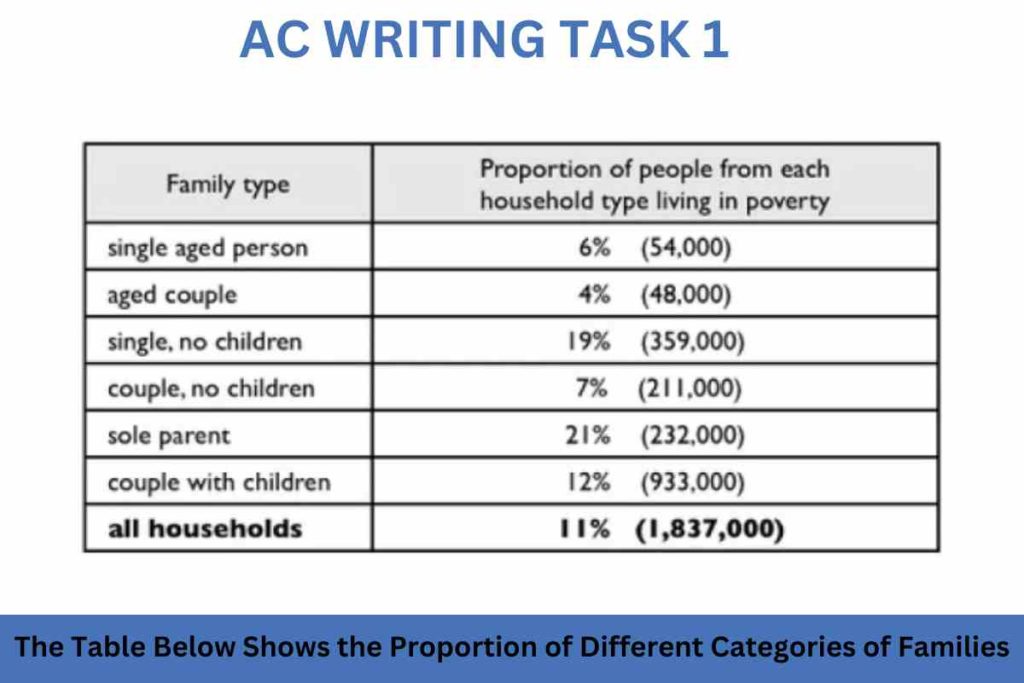
The Table Below Shows the Proportion of Different Categories of Families

The Table Below Shows the Proportion of Different Categories of Families

The table below shows the proportion of different categories of families living in poverty in Australia in 1999. Summarise the information by selecting and reporting the main features and make comparisons where relevant. SAMPLE ANSWER 1:-The Table Below Shows the Proportion of Different Categories of Families As from the upper table information, prevailing a view

The Table Below Shows the Proportion of Different Categories of Families Read More »

IELTSFever FREE Online Mock Test Day 630 Recent IELTS Exam Tests

IELTSFever FREE Online Mock Test Day 630 Recent IELTS Exam Tests

IELTSFever FREE Online Mock Test Day 630 Recent Exam Tests Must Read These Instructions before participating in Exam. The answer to every question is mandatory; otherwise, we will not accept it. Send your answers to [email protected] with your name and city along with the question Test Number, like IELTSFever FREE Online Mock Test Day 630

IELTSFever FREE Online Mock Test Day 630 Recent IELTS Exam Tests Read More »

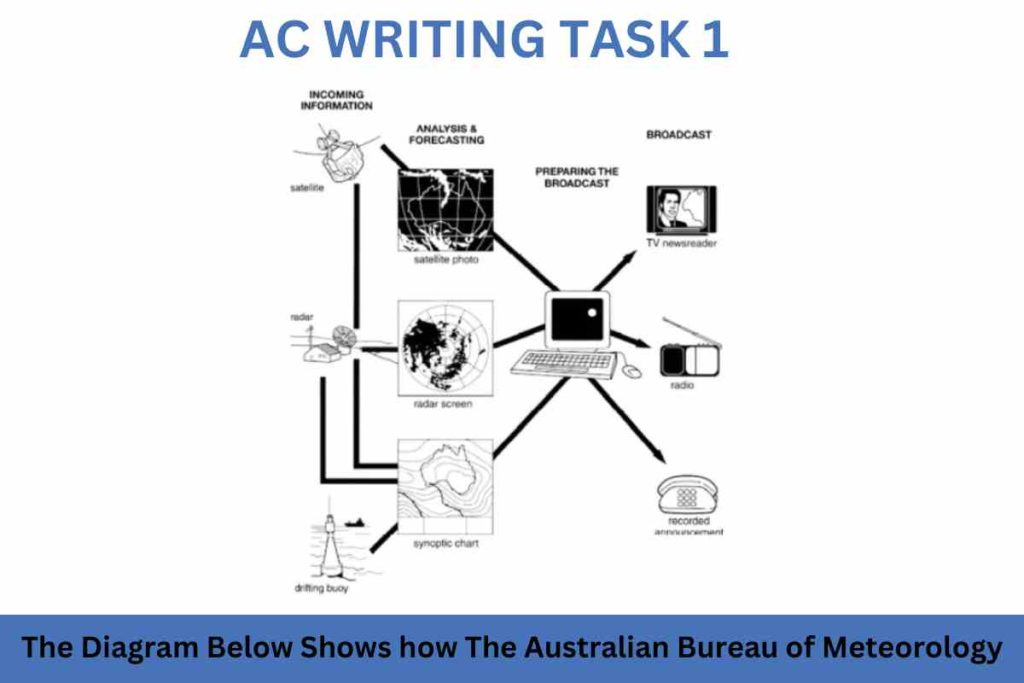
The Diagram Below Shows how The Australian Bureau of Meteorology

The Diagram Below Shows how The Australian Bureau of Meteorology

The diagram below shows how the Australian Bureau of Meteorology collects up-to-the-minute weather information to produce reliable forecasts. Summarise the information by selecting and reporting the main features and make comparisons where relevant. SAMPLE ANSWER 1:-The Diagram Below Shows how The Australian Bureau of Meteorology As from the upper diagram represtation, providing us a clear

The Diagram Below Shows how The Australian Bureau of Meteorology Read More »

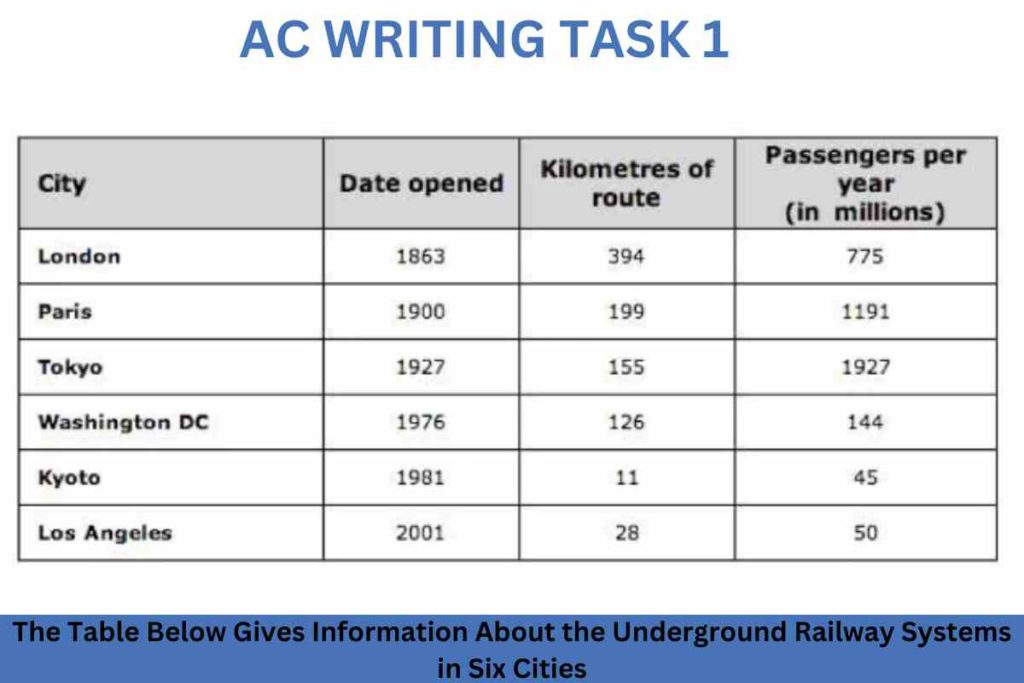
The Table Below Gives Information About the Underground Railway Systems in Six Cities

The Table Below Gives Information About the Underground Railway Systems in Six Cities

The table below gives information about the underground railway systems in six cities. Summarise the information by selecting and reporting the main features and make comparisons where relevant. Sample 1:-The Table Below Gives Information About the Underground Railway Systems in Six Cities The given data illustrates the information of opening date, the number of passengers

The Table Below Gives Information About the Underground Railway Systems in Six Cities Read More »

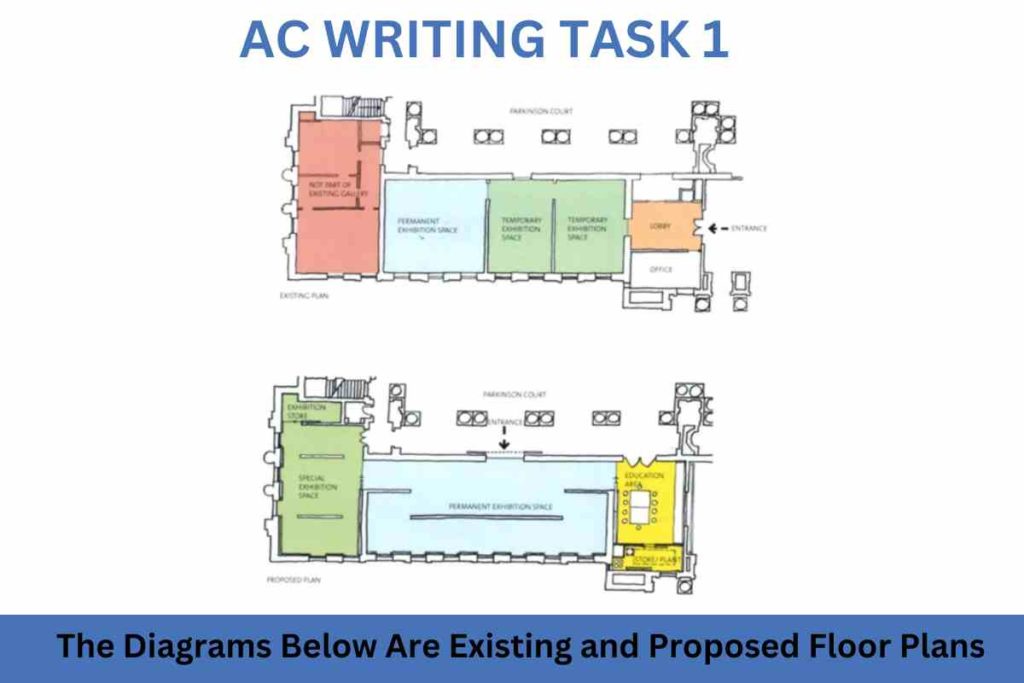
The Diagrams Below Are Existing and Proposed Floor Plans

The Diagrams Below Are Existing and Proposed Floor Plans

The diagrams below are existing and proposed floor plans for the redevelopment of an art gallery. Summarise the information by selecting and reporting the main features and make comparisons where relevant. Sample 1:-The Diagrams Below Are Existing and Proposed Floor Plans The pictures illustrate the floor plan for the renovation of an art gallery. In

The Diagrams Below Are Existing and Proposed Floor Plans Read More »

Scroll to Top